Slide 16 of 19
Notes:
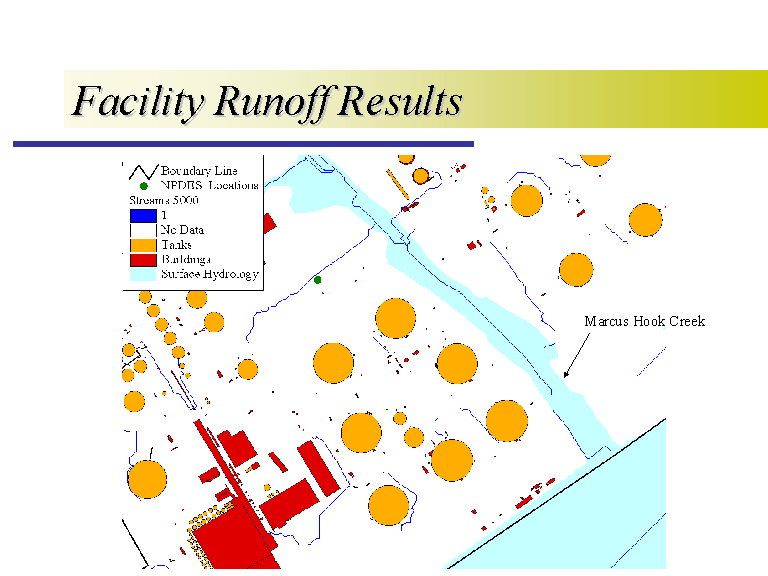
Here are the results for the facility model, and I have zoomed in to show more detail. This model is really unique from other runoff models because of the scale we are dealing with. In the regional analysis, I used a 30 meter dem, which is very typical. For this analysis, I used a 3 ft dem, meaning the program determines the flow direction from each 3 ft. grid cell across the refinery. This model was also unique in that I had to account for a lot of features on this scale that you do not have to account for in a regional model, such as flow around buildings and sewer drains. You see there is no flow through any structures in this result, and these small streams that appear to start and stop are actually outleting to a drain. So how well does this model compare with reality. There is actually no storm water management plan at this facility because all runoff is supposed to be channeled through one of the NPDES sampling locations. You can see one of the sampling locations here and there is a runoff stream through that point. There are some additional drainage streams to the creeks and river, but for the most part the results are very good, and it turns out that the drainage areas to the surface water bodies are fairly small.


