Slide 15 of 19
Notes:
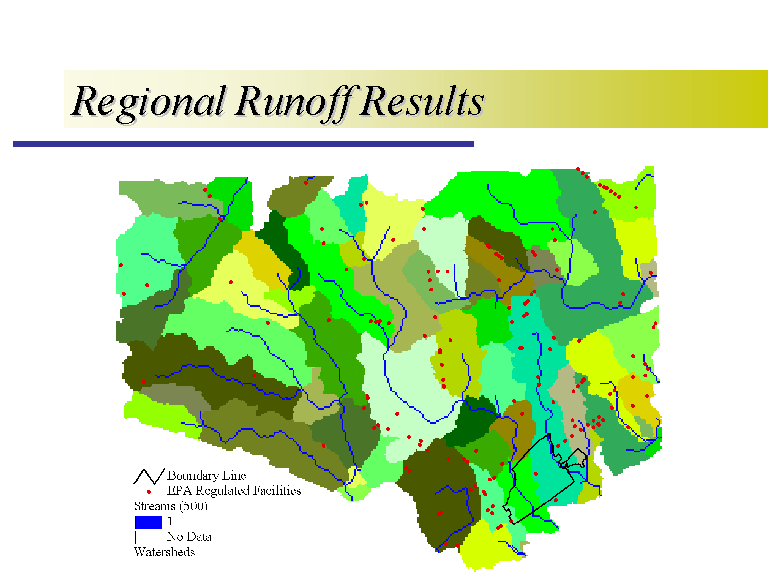
Here is the regional runoff model which was created using the Watershed Delineator extension to ArcView and some of the regional data I obtained in the data development phase. Each green area is a separate watershed and the blue lines are delineated streams. With these results, we can look at the facilities in each watershed for the two creeks and then use some NPDES permit information to calculate background concentration levels in the creeks upstream of the refinery.


