Slide 7 of 14
Notes:
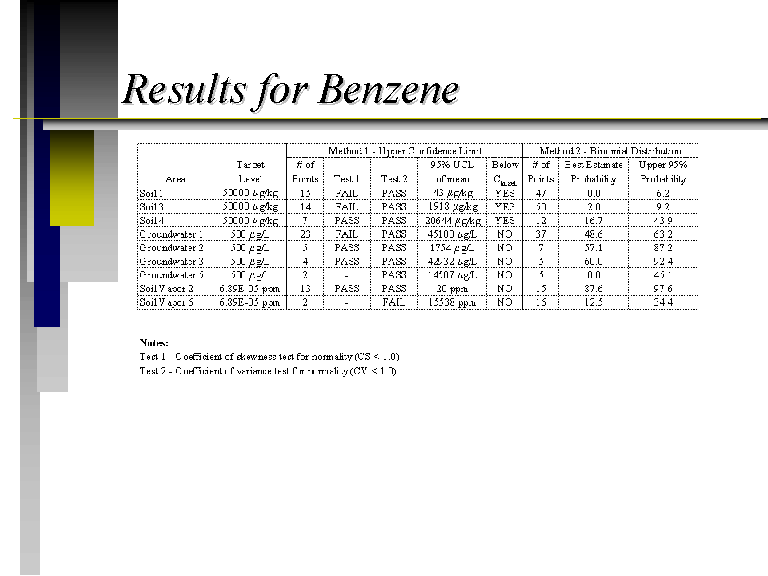
Here are the results for benzene using the first two methods. The first column is the source area and the second column is the target level. These target levels originate from the Pennsylvania Department of Environmental Protection. The next five columns show the results for the UCL method. The number of points is the number of measurements in each area. Test 1 says whether or not the log-transformed data passed to the coefficient of skewness normality test. You can see there are a few failures. Test 2 says whether or not the data passed the coefficient of variance normality test, which is not as good a measure as Test 1. The next two columns show the calculated UCL and whether or not this UCL is below the target level. A Yes means the area is OK. The next three columns show the results for the binomial method. The # of points is again the number of measurements, but this time including no-detects. You then have the best estimate and upper bound probabilities. A couple of things to point out. Only the soil source areas for benzene have a UCL below the target level. I also looked at four other chemicals: ethyl benzene, toluene, xylenes, and naphthatlene. The UCL’s for these other chemicals were typically lower than the target levels in all areas except the soil vapor source areas. The soil vapor targets are very low, usually lower than the detection limits. Also take a look at how the # of measurements affects the outcome. The UCL is extremely large in soil vapor source area 6 compared to soil vapor source area 2, but the probabilities are smaller for area 6 than 2. This relates back to the fact that the UCL method does not account for no-detects, of which there are 14 in source area 6. Thus, only two measurements get used in the UCL calculation.


