Slide 6 of 14
Notes:
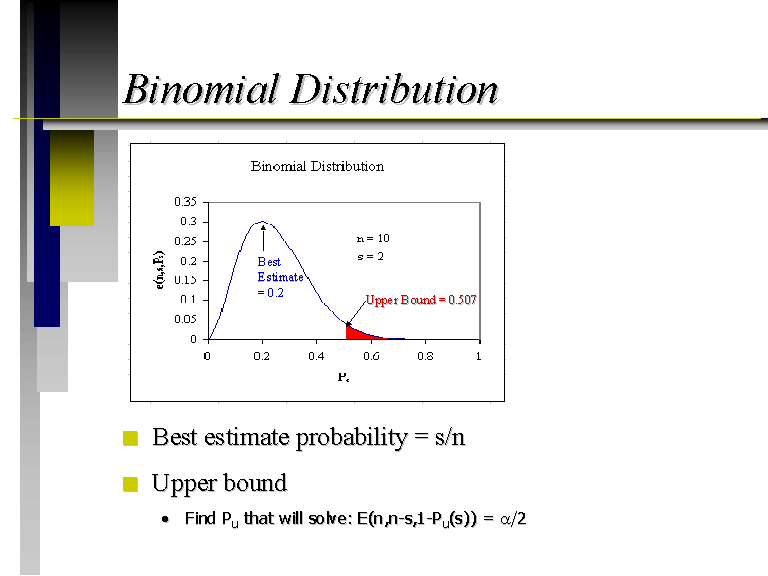
This graph shows the binomial mass function for a data set with 10 trials and 2 successes. The y-axis is the formula on the previous slide, and the x-axis is the probability a sample will be above the target level. However, this is the probability we want to find. We can estimate this value in a couple of ways. If we have a certain number of samples, the best estimate of the probability that a sample will be above a target level is simply the number of successes divided by the number of trials as seen here. However, we would like to obtain a more conservative screening level with which to make decisions, such as a 95% upper exceedance probability. This upper bound can be solved for by finding the value of p that will solve the equation shown.


