Slide 8 of 14
Notes:
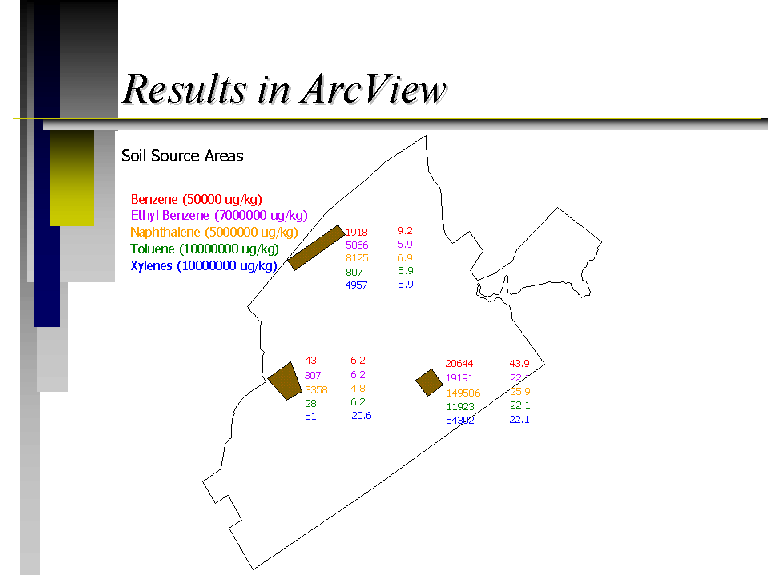
Here are the results in ArcView for each chemical in each soil source area. The first column is the UCL, and the second column is the upper bound probability. The target level is shown in parentheses for each chemical. Notice that the soil concentrations are pretty low.


