Introduction
The quality of our environment and particularly our water has become a matter of interest to many people. The quality of our water is a direct indicator of the health of our environment. In Texas, river authorities have been charged with monitoring the water quality of the river basins. The Lower Colorado River Authority (LCRA) oversees the lower Colorado River watershed. One program that the LCRA has initiated to help monitor and protect the water quality of the Colorado River is a volunteer citizen water quality monitoring program called the Colorado River Watch Network (River Watch).
The emphasis of my project is on monitoring data collected by the volunteers and staff of the River Watch program. Currently the River Watch is maintaining approximately 50 active monitoring sites throughout the lower Colorado River basin. These sites are being monitored by about 30 schools and 40 citizen monitors. Water quality monitoring in the Austin area is particularly strong with a coalition of water monitoring groups coordinated by the Austin-Area Volunteer Monitoring Coalition. The River Watch is part of this coalition along with the City of Austin's Water Watchdogs, Travis County's Creek Watch, the Austin Youth River Watch, and the TNRCC's Texas Watch.
A number of different organizations and government entities operate professional water quality monitoring sites in the Colorado River watershed and particularly in the Austin area. There are active water quality monitoring programs by the United States Geological Survey (USGS), the Lower Colorado River Authority, the Texas Natural Resource Conservation Commission (TNRCC) and various departments of the City of Austin.
For several years I volunteered as a citizen water monitor for the River Watch gathering data at a site on Town Lake on a weekly bases. I was inspired by the fact that the River Watch program gets citizens involved in monitoring the quality of the environment, increases people's awareness of their watersheds, and gives them a sense of personal responsibility for protecting their water. The River Watch is doing an excellent job of getting citizens involved in water monitoring and the amount of data is growing daily.
The following is the mission statement of the River Watch which leads to the goal of this project:
Mission Statement of the Colorado River Watch Network
"The mission of the Colorado River Watch Network is to encourage and support community-based environmental stewardship by providing citizens, teachers and students with the information, resources and training necessary to monitor and protect the waterways of the lower Colorado River watershed. Combining water quality monitoring instruction with "hands on" laboratory and field experience motivates students and citizens to become active in local environmental issues. River Watch succeeds because it serves a public desire to be involved in environmental management and because it recognizes the value of credible data. Following careful training and quality assurance techniques, River Watch volunteers collect meaningful water quality information. Data collected by the monitors is used by the Lower Colorado River Authority to supplement its own professional monitoring efforts. Network monitors also serve as an early warning system for environmental threats. Data is available for public review and has been used toidentify areas of concern for professional investigation. In recognition of the volunteers' commitment, every year CRWN provides a site-specific data report for each monitor who regularly collects and submits data."
This term project is the initial step in exploring ways that GIS programming can assist the Colorado River Watch Network in achieving the following aspects of it's mission:
1) Demonstrating the credibility of the monitoring data
2) Providing an environment to effectively integrate the volunteer monitoring
data with professional monitoring data
3) Developing methods to use the data in GIS as a potential "early
warning system for environmental threats".
4) Developing methods to use the data in GIS to generate site-specific
data reports for each monitor with long-term trends and spatial graphics
showing the trends at other near-by sites.
The objective of this term project is to create a model GIS project in which citizen water quality data can be easily accessed and viewed in relation to the spatial environment. Water quality data from the USGS is also used. The methods of processing the data and setting up the GIS project are described in detail so that others interested in this method of working with water quality data can reproduce it.
The model watershed chosen is Barton Creek, a watershed in the Austin metropolitan area that is currently under rapid development. It is the focus of much environmental debate and many legal fights. Of particular interest in the watershed is Barton Springs a large natural spring near downtown Austin that has historically been a popular place of recreation for people living in the area and considered by many to be the "soul" of Austin. The Edwards Aquifer recharge zone cuts across the Barton Creek watershed. The Edwards Aquifer is the source of Barton Springs and is an important source of water for Central Texas. Water quality measurements of the springs are included in the project and the location of the Edward Aquifer recharge zone is available to be viewed.

The GIS software program used is Arc/Info and Arcview, developed by Environmental Systems Research Institute (ESRI)
The Data
River Watch Water Quality Data
Volunteers for the River Watch must participate in a three-phase certification process to become water quality monitors. This certification process is modeled after the TNRCC's Texas Watch program. Monitors use field kits specifically designed for the program and most of the measurements are made at the site.
The following water quality indicators are measured:
- Water Temperature: Centigrade Degrees
- pH
- Total Dissolved Solids: parts per million (ppm)
- Dissolved Oxygen (mg/L)- using the Winkler Method
- Nitrates- measured as nitrate-nitrogen (mg/l)
- Phosphates- measured as ortho-phosphorous (mg/L)
- Fecal Coliform: colonies per 100 mL, membrane filter test
USGS Water Quality Data
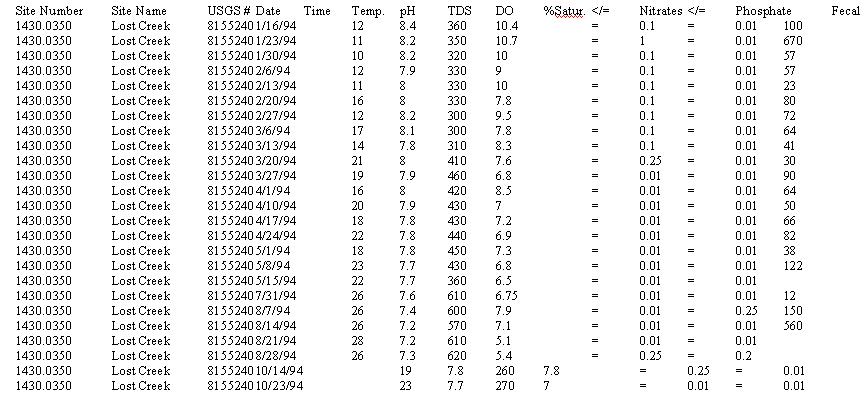
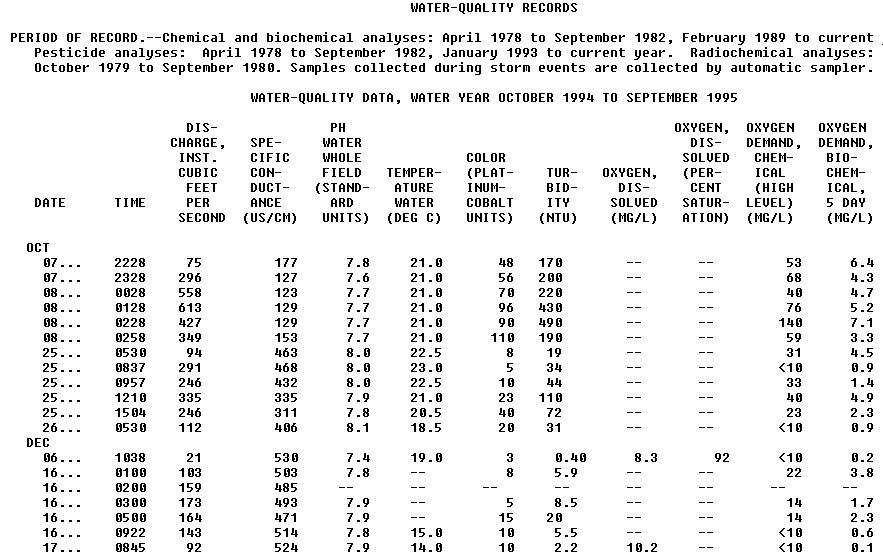
Water quality data is collected by the USGS using automated sensing devices. Flow data is also collected at each water quality monitoring site. The USGS measures a wide variety of water quality indicators. For this project I have chosen the indicators that best match those measured by the River Watch plus the specific conductivity. The data is available in two different formats over the internet. One is in a single column form for all the data available with a code for each different water quality parameter (LINK to example).
The following image is an example of the format of the USGS water quality data I used downloaded from the USGS web site for Barton Creek at Highway 71 (1995 Station Data Page). The data is organized by "water year" (October-September) and the data is arranged in an orderly table with column headings. The average daily flow data for the site is also available in the same table.
-Weighted Flow Calculations with USGS Data
The USGS data is given in two forms over the year. One is storm event
data which is given as a series of sets of water quality measurements
over a time period in which the the stream flow increases, peaks and decreases
again, a storm event. The second form is baseline data which is
a single set of water quality measurements at a one time. A weighted flow
calculation was done to the storm flow data so that a single representative
quantity for the water quality parameter can be given for that storm event.
Below is a image of the spread sheet calculation for nitrates on May 29,
1994 at the Highway 71 USGS site:
For this model I chose a time period that had about average rainfall and Barton Creek was flowing for much of the year, the USGS 1994-95 water year. During periods of drought Barton Creek is dry. I used the USGS Discharge Data for Texas and chose a period during which the creek had some flow for a good part of the year.
Procedure for producing the model for this project
First, create a directory in the Alpha system to keep the project files. (Note: Text in italics is copy from the alpha system)
1) Obtain the Digital Elevation Model (DEM) of watershed, Delineate watershed , Delineate streams
For this project the geographic base map for the Barton Creek watershed was obtained from work being done by Christine Dartiguenave. The procedure that was used to delineate the watershed and streams is described in detail on Dr. Maidment's Spring 1997 GIS Class home page, Exercise 2. Delineation of Watersheds and Streams. 30 meter DEM,s for watersheds in the immediate Austin area are available on CD-ROM. 3 arc-second DEM's for anywhere in the US are available through the USGS web site. Further work with the larger Colorado River watershed will require the use of this data and the delineation of the watersheds and streams.
The coverages used in this project are projected in State Plane coordinates, zone 5376. This is a Lambert conformal conic projection established for legal surveys in Texas.
In Arcview open a new project and import the base map themes for the watershed boundaries and streams.
2) Create Point Coverages of monitoring sites.
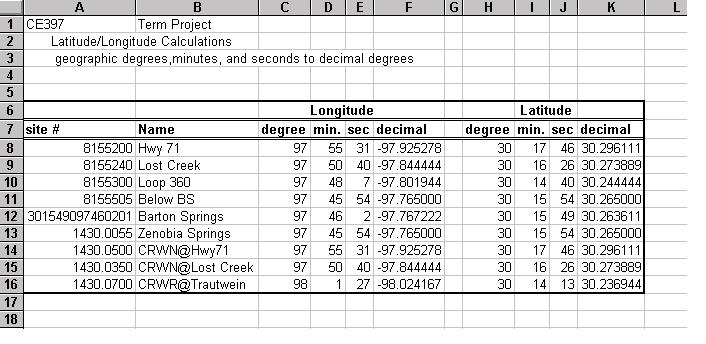
a) An ID number and the latitude and longitude of each site are the necessary data to create the point coverages. The name and number of the sites are added to the point attribute table after it is created. The USGS site locations in the Barton Creek watershed were obtained from the USGS site information page on the internet. All the coordinates were in geographic degree, minutes, and seconds. For the Barton Creek watershed several of the USGS sites were at the same location (by name) as the River Watch stations but the geographic coordinates were slightly different. At locations with both River Watch and USGS sites the USGS longitude/latitude data was used for both.
If the coordinates are in geographic degrees, minutes, and seconds then it is necessary to convert to decimal degrees since this is the form needed to work within Arc/Info. Use the following equation for the conversion:
Decimal Degrees = Degrees + minutes/60 + seconds/3600 (the west longitude is negative)
Do the conversion the using an Excel spreadsheet and save it for further conversions. See an example spreadsheet below.
b) Create a text file containing the ID information and the longitude/latitude coordinates of the sites. In Text Editor in Arcview open a new file and create a file as shown below: