Slide 4 of 14
Notes:
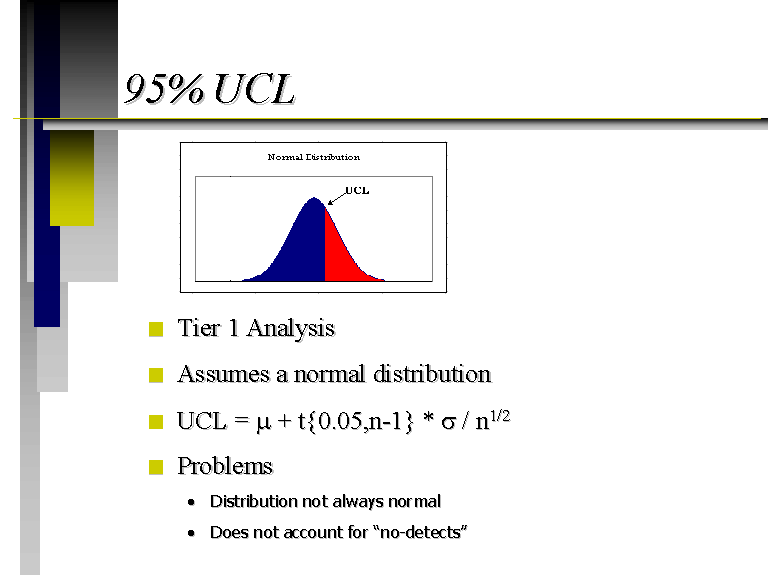
This graph shows a typical normal distribution. The UCL is the value that when calculated for a random data set equals or exceeds the true mean 95% of the time. This is a conservative value that is used in initial screenings, such as a Tier 1 Analysis where we are only looking at exposures in the source area. It assumes a normal distribution and can be calculated with this formula where mu is the mean, t is the t-statistic, sigma is the standard deviation, and n is the number of trials. This UCL can then be compared with an RBSL. If it is significantly lower than the RBSL, this source area can probably be eliminated from analysis. The problems with this method are that the distribution is not always normal and it does not account for no-detects. You can use log-transformed data, but sometimes that data will not even pass normality tests with concentration measurements. No-detects are simply the samples that had concentrations below the detection capabilities of the laboratory instruments used in the analysis.


