HOME
RESEARCH
PERSONAL
CLASSWORK
CE 394K.2 - Surface Water Hydrology
College of Engineering
The University of Texas
Term Project
GIS-Based Infiltration Modeling
Incorporating the Green-Ampt Infiltration Model into CRWRprepro
Chapter 1 Introduction
1.1 Objective
The objective of this project is to incorporate the Green & Ampt method for infiltration modeling into CRWRprepro.
1.2 Background and Motivation
Infiltration is the movement of water downward through the soil. The rate at which water can flow through the soil depends on the properties of the particular soil and it’s water content at the surface. This loss of water to the soil is known as an abstraction. Other loss mechanisms include streambed losses, interception, and storage within topographical depressions.
There are several models to calculate abstraction due to infiltration including the SCS method and the initial loss plus constant loss rate model. However, these models have limitations. The SCS Curve Numbers relating abstractions to soil types and land use have been arbitrarily determined, and the initial loss plus constant loss rate model is a non-physical model calibrated with gaged data. A more advantageous method to determine abstractions is to relate loss rates to physical characteristics of the watershed in a continuous simulation so that loss rates may be computed as a function of soil moisture conditions at the beginning of a storm (Reed and Maidment 1998). The Green & Ampt Infiltration Model is a physical model which relates the rate of infiltration to measurable soil properties such as the porosity, hydraulic conductivity, and the moisture content of a particular soil. An illustration of simplified model proposed by Green and Ampt is shown in Fig. 1 (Source: Chow, Maidment, and Mays 1988).

Figure 1: Simple model representing infiltration of surface water into the soil horizon.
The Green & Ampt model assumes that infiltration occurs from a ponded surface of depth h0 into a deep soil column of length L and the water enters the soil as a slug according to Darcy’s Law (f = K ¶h/¶z). Furthermore, the model assumes a sharp wetting from separating a wetted zone from an unwetted zone with an initial moisture content q i. According to these model assumptions, infiltration can calculated from the expression:

Where K is the hydraulic conductivity, D q is the change in moisture content, Y is the wetting front suction head, and F(t) is the cumulative depth of water infiltrated. By incorporating the Green & Ampt method into CRWRprepro it is possible that a more accurate determination of losses due to infiltration can be made.
Chapter 2 Methodology
2.1 Study Area
The study area used is the Guadalupe basin located in central Texas. This area was selected because the data necessary for delineation of this basin was readily available.
2.2 Required Data
The data required to analyze the Guadalupe basin included:
- 30-m DEM of the study area
- A STATSGO map of soil textures for the study area supplied by the USGS
- Database files called mapunit.dbf and comp.dbf supplied by the USGS. The mapunit table holds the key to relating soil attributes to polygons on the map. One record exists in the mapunit table for each mapunit. A single record in the mapunit table relates to one or more components in the comp table.
With the use of CRWRprepro the Guadalupe basin was delineated and the STATSGO soil texture map was clipped to include only the study area. (To see the steps necessary to delineate and clip the necessary soil texture data refer to http://www.engr.utexas.edu/giswr/secure/Module3/exercise3/delinex.htm and http://www.engr.utexas.edu/giswr/secure/Module5/exercise5/landsoil.htm).
The delineated watershed with the clipped soil texture data can be seen below in Figure 2.

Figure 2: Guadalupe basin overlaid with STATGO soil texture data
2.3 Creating an ArcView GIS Script using Avenue
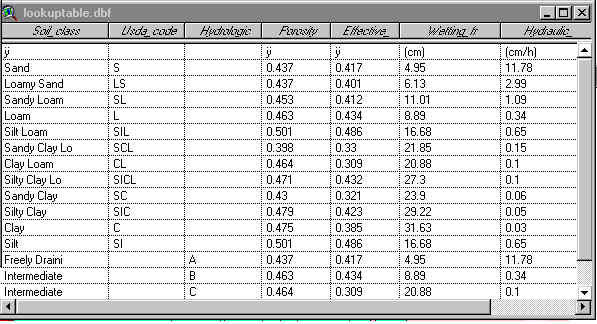
The purpose of CRWRprepro is to generate a basin file for the Hydrologic Engineering Centers program Hydrologic Modeling System (HEC-HMS). This basin file created from spatial data includes parameters for calculating time dependent variables such the quantity of runoff from a particular waterhsed. To include Green & Ampt parameters in the basin file, a lookup table approach was applied. The lookup table includes Green & Ampt infiltration parameters for the 12 USDA soil texture classes. The lookup table also accounts for the possibility of soil classes not included in the USDA classification system by assign parameters according to the soils hydrologic group. Figure 3 illustrates the lookup table to be used.

Figure 3: Lookup table of Green & Ampt infiltration parameters
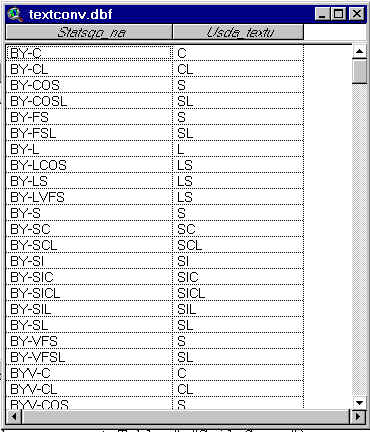
Surface textures for each polygon are assigned in the component table (comp.dbf) supplied by the USGS. The USGS uses 719 different surface textures, so to these soil textures had to be related to the 12 USDA soil textures. To do this a texture conversion table was used. This conversion table (Figure 4) was acquired from Reed and Maidment 1998. This table is a modified version of the Miller and White reclassification table.

Figure 4: Texture conversion table for converting 719 USGS soil textures to 12 USDA soil textures
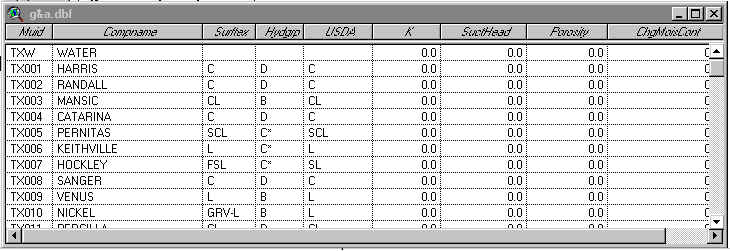
All necessary data are then compiled in a new table referred to as g&a.dbf (Figure 5).

Figure 5: g&a.dbf table that contains data compiled from the mapunit table and the component table
After the table has been populated with the Green & Ampt variables from the lookup table, the change in moisture content (D q = h - q i) is calculated for each mapunit according to a user input initial moisture content, q i. Next, the subwatersheds of the basin are assigned area-weighted averages for each parameter necessary to complete the HMS basin file. This method oversimplifies the calculation of the wetting front suction head Y , and the hydraulic conductivity due to great dependence on the initial moisture content but future modifications will be added as needed after initial quality assurance and quality control (QA/QC) measures have been completed. These QA/QC measures will include running a rainfall simulation in HMS using basin files employing the SCS method, the initial loss plus constant loss rate method and the Green & Ampt method.
2.4 Step by Step of Avenue Script txdot.g&aparam

- The script requires that the user identifies the soil theme to be used, the coverage used here is the Statsgop file.
- Next, the script asks the user to identify the table containing the map unit id numbers for each polygon. In this case, because the soil coverage has been clipped to match the watershed the required map unit id numbers can be found in the attributes table of the shape file called gs.shp
- Next, the script asks the user to identify the component table which contains the surface textures of each polygon. The script joins the component table and mapunit table so the surface textures can be assigned according to the map unit id number.
- Next, the script asks the user to identify the soil conversion table.
- Next, the script creates the g&a.dbf table. This table does not yet contain the Green & Ampt parameters necessary for the basin file.


Chapter 3 Conclusion and Future Work
By incorporating the Green & Ampt method of infiltration modeling into CRWRprepro it will be possible to use physical parameters of soil texture to determine infiltration rates. Previously, CRWRprepro has used only the SCS method and the initial loss plus constant loss rate method. It is expected that with the use of the Green & Ampt model, infiltration rates will be better estimated in HMS and will make CRWRprepro more useful.
Future work for completing the txdot.g&aparam script includes:
- Accessing the lookup table and assigning the necessary parameters.
- Creating an area-weighted average for each parameter in each subwatershed.
- Incorporating the script into CRWRprepro
- QA/QC