HOME
RESEARCH
PERSONAL
CLASSWORK
CE 394K.2 - Surface Water HydrologyCollege of Engineering
The University of Texas
College of Engineering
The University of Texas
Exercise 1
QUESTION 1
The following picture shows a schematic of Waller Creek using HEC-HMS.

QUESTION 2
The following table shows the area of each subbasin on Waller Creek. Also presented is the total drainage area for the entire watershed.
|
Subbasin No. |
Area (km2) |
|
12 |
3.602 |
|
13 |
6.912 |
|
14 |
0.966 |
|
15 |
0.563 |
|
16 |
1.633 |
|
17 |
0.437 |
|
18 |
0.252 |
|
Total Area (km2) |
14.365 |
QUESTION 3
The parameter values for subbasin 13 include:
- Loss rate – this parameter measures the abstractions due to infiltration
- Initial loss is set a 5mm – this parameter measures the initial abstraction which occurs as the storm begins
- Constant rate refers to the rate at which water is lost due to abstraction throughout the duration of the storm.
- Imperviousness refers to the amount of ground cover that cannot be infiltrated by runoff.
The parameter values for reach 10 include:
- The river routing method used is the Muskingum method which is a flow routing method for channels with a variable discharge-storage relationship. The procedure is used to determine the time and magnitude of flow.
- Muskingum K refers to the travel time of the flood wave.
- Muskingum X refers to the storage in the reach.
QUESTION 4
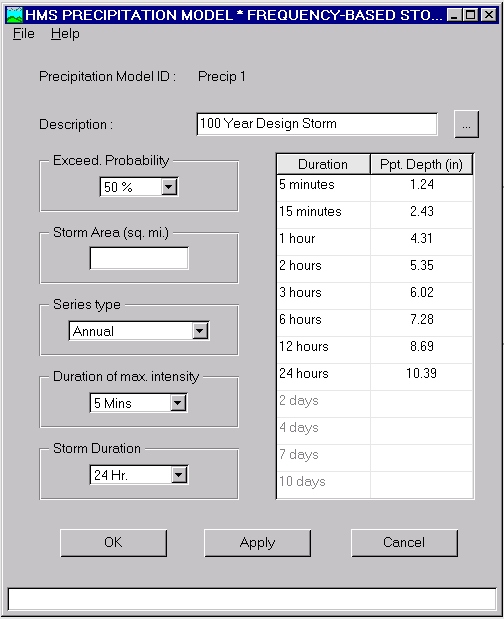
The following picture shows the design precipitation input file from HMS.

QUESTION 5
For a 3 day simulation with 10 minute intervals there will be a total of 432 intervals.
QUESTION 6
The following table shows the peak discharge, the drainage, and the peak discharge/drainage area for each of the six outlet points on Waller Creek.
|
Outlet Point |
Peak Discharge (cms) |
Drainage Area (km2) |
Q/A (cms/km2) |
|
Junction w/ Hemphill |
40.443 |
10.514 |
3.846585505 |
|
MLK |
40.107 |
11.48 |
3.493641115 |
|
15th St. |
39.892 |
12.043 |
3.312463672 |
|
7th St. |
39.781 |
13.676 |
2.908818368 |
|
1st St. |
39.405 |
14.113 |
2.792106568 |
|
Colorado River |
39.119 |
14.365 |
2.72321615 |
QUESTION 7
In order to determine the design discharge of Waller Creek at 15th Street, a 100-year design storm was used for the precipitation file in HMS, shown below.

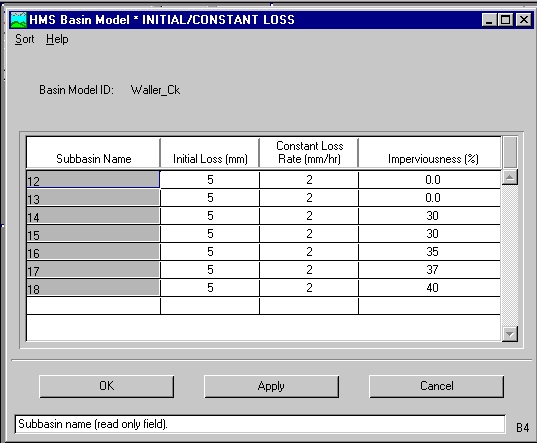
Also, I changed the percent impervious coverage as the creek moves through Austin, shown below.

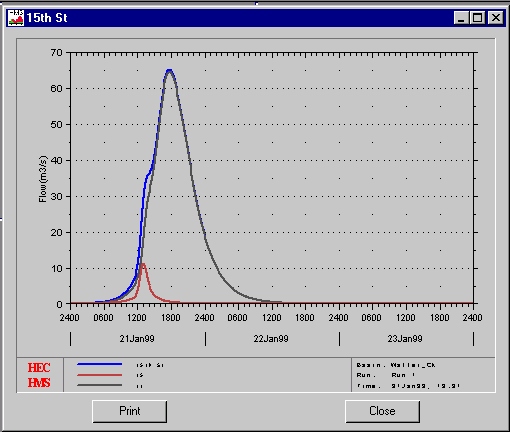
The design discharge using these input values was determined to be 65.029 cms. A hydrograph of the discharge is shown below.

These values can be double-checked by referring to the stream gauge data provided by the USGS or use a plot of flow vs. drainage area which has previously been determined.