
Exercise 6
Nonpoint Sources in Tillamook Bay
- Getting Acquainted with the Basin DEM
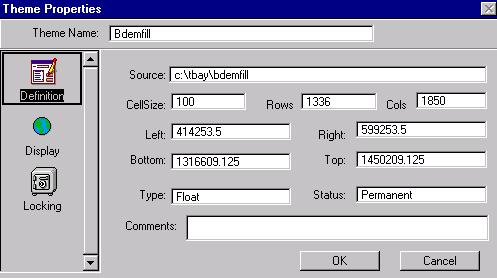
Questions can be answered from the information showed in the Theme/Properties Table.

The cell size of the grid is 100 ft x 100 ft which is 10,000 ft 2 covered per cell in the grid.
The number of rows is 1,336.
The number of columns is 1,850.
The number of cells in this grid is 1,336 x 1,850 = 2,471,600.
The land surface area coverd by this grid is 24,716,000,000 ft 2.
- Annual Precipitation in the Basin
The range of precipitation across the basin is 56.2 - 178.3 in/yr.
The basin mean precipitation is 109.4 in/yr corresponding to 2,779 mm/yr.
The grid cell size used for the calculation is 100 ft x 100 ft.
- Runoff and Baseflow Grids
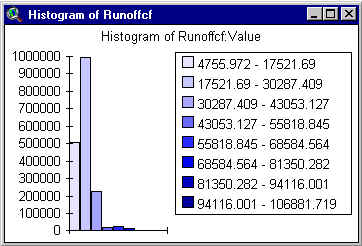
The mean value of the runoff is 23,097 cf/yr (27.7 in/yr) and the range of runoff is 4,755 cf/yr (5.7 in/yr) - 106,882 cf/yr (128.3 in/yr).

The range of baseflow is 0 - 75,751 cf/yr (0 - 90.9 in/yr) and the mean value of the runoff is 48,030 cf/yr (57.6 in/yr).
52.4 % is discharged as baseflow and 25.2 % as runoff.
- Estimating Annual Loadings
Units analysis for the load calculation to 'prove' that the conversion factor of 283 leads to the correct units for the bacteria loading (fc/yr).

Wilson River profile of predicted fecal coliform concentration associated with surface runoff.
The accumulated load in Wilson River at the forest/agriculture interface is around 1 x 10¹⁴ fc/yr while the accumulated load at the mouth is approximately 1.5 x 10¹⁵ fc/yr. That means the Ag/CAFO lands contribute with more than the 93 % of the total load accumulated at the mouth.Following table shows the accumulated bacteria loads to each of the 5 bay segments.
Prepared by Esteban Azagra
14 October 1998