
Engineering Computer Graphics Laboratory, Brigham Young University
Introduction
The Watershed Modeling System (WMS) was developed at the Engineering Computer Graphics Lab (ECGL) in cooperation with US Army Corps of Engineers Waterways Experiment Station (WES) and the Federal Highways Administration. The focus of WMS is to provide a single application which integrates digital terrain models with industry standard runoff models such as HEC-1 and TR-20. WMS can be used to develop hydrologic data from TINs or grids using many of the same techniques described in other sections of this CD, in particular GH-Terrain. In this way, hydrologic data developed in Arc/INFO, ArcView, or WMS can be directly linked to many common hydrologic models. While TINs or grids developed in Arc/Info or ArcView may be exported to WMS for further hydrologic data development, the primary way in which data is shared between the GIS and WMS is through three shapefiles: a polygon shapefile for basin boundaries, a line shapefile for stream networks, and a point shapefile to identify outlet locations. The watershed delineation tool in GH-Terrain, developed by ESRI, can be used with the Arcview Spatial Analyst extension to automatically generate these three shapefiles, including population of their attribute fields with important hydrologic parameters. These data can then be used in WMS to create an initial model for any of the hydrologic programs supported by WMS. Data entry for the hydrologic model, including Rainfall, job control, or any other parameters not defined as attributes in the shapefiles, can be completed using WMS's hydrologic modeling interface. WMS can be used to post-process and then export results back to the GIS software.
Figure 1. The Watershed Modeling System imports ArcView shapefiles for use in creating HEC-1, TR-20, and other hydrologic models.
From its very inception GIS has been an excellent tool for data storage and management. With the creation of GRID in Arc/Info and the Spatial Analyst in ArcView, GIS has become more useful for hydrologic data development as well. And yet much of this data, both stored and developed in the GIS, remains locked to hydrologic modelers. Even though GIS holds much promise as a tool for performing spatial hydrologic runoff modeling (particularly on a regional basis), much of the analysis performed must be done using industry standard, lumped parameter models such as HEC-1 and TR-20. While much of the input required to run these models can still be developed using GIS, some parameters such as rainfall, time steps, and other model-specific parameters can not, and typically are not efficiently entered and stored in the GIS.
In order to "unlock" hydrologic data developed/stored in GIS for use in hydrologic models a link consisting of three primary shape files has been developed as a joint effort by ESRI and ECGL. The link provides a common gateway to transfer data from a GIS to a hydrologic modeling system such as WMS. These three shapefiles consist of:

Figure 2. A shapefile of stream lines defines the topographic layout of the watershed.

Figure 3. A shapefile with points defines the watershed and sub-basin confluence locations.

Figure 4. A polygon shapefiles define sub-basin boundaries.
In addition to the geometry stored in the shapefiles, any number of hydrologic modeling related attributes may be stored as part of the shapefile. These attributes may be developed using the Spatial Analyst or manually entered.

Figure 5. Both geometric and attribute data stored in ArcView are used in model creation.
These three shapefiles can then be imported into any program designed for hydrologic modeling. The combination of outlet points, stream network, and sub-basins will uniquely define the watershed structure, and attributes can be used to set up any hydrologic model for which the application is designed to support.
In order to demonstrate how hydrologic models can be developed from these three shapefiles, an interface to import them has been created in the WMS, an application which already supports the processing of digital terrain data for use in the development of hydrologic models such as HEC-1 and TR-20.

Figure 6. Attributes which use specified keywords for item names are automatically mapped when importing shapefiles.
As the shapefiles are read by WMS, key words for database item names such as area, slope, curve number etc. are checked against several defined names in order to automatically "map" these variables for use within WMS. If the shapefiles were created using the customized scripts for the ArcView Spatial Analyst (described in more detail below) then they will be created with the proper item names to automatically map in WMS. If the item names to match the pre-defined names then the user can manually map the item names in the database (dbf) file to their corresponding use in WMS using the dialog shown below.

Figure 7. Any attribute can be manually mapped or unmapped to corresponding WMS parameters.
Once the mapping has been defined the shapefiles are read in and converted to a digital and topological representation of the watershed as shown in the next figure.

Figure 8. The three shapefiles are used to create a topologic representation of the watershed used in interfacing to hydrologic models.
As mentioned above, any variables read in through the shapefile interface can be mapped to their corresponding values in WMS. As a minimum, basin areas and stream lengths will be defined. Since WMS was designed specifically for hydrologic modeling applications it is not important that all parameters be computed in ArcView prior to exporting the shapefiles for use in WMS. Missing data can be defined inside of WMS and properly formatted for any of the supported models. The hydrologic analysis can then be done in WMS and results sent back through the same three shapefiles for storage/query from ArcView.

Figure 9. Typical results of hydrologic models include flood hydrograph and peak flows.
In order to facilitate the development of hydrologic data from grids in ArcView some sample extensions have been created by the ESRI development team. Some of the scripts were included as a sample application with the initial release of Spatial Analyst 1.0. These functions have been combined with several other commands in order to provide a more complete tool for developing hydrologic data in preparation of using industry standard hydrologic models such as HEC-1 and TR-20. Some of these scripts have been gathered together and automated in the watershed delineation tool contained in GH-Terrain. The scripts include the following capabilities:
Initially, the following attributes for the three different shapefiles will be exported:
For stream line shapes
For outlet point shapes
For polygon basin shapes
Other attributes for the different shapes will likely be added as the project progresses.
While WMS has been used to show how the resulting shapefiles can be linked to hydrologic models, the format is open and can be processed by any program designed specifically to interface to rainfall/runoff programs.
HEC-1, developed by the Hydrologic Engineering Center in Davis, California, has long been one of the industry standard programs for hydrologic analysis. It is a single-event, lumped parameter model, but includes several different options for modeling rainfall, losses, unit hydrographs, and stream routing. The HEC-1 interface in WMS makes it simple to enter and manage input data and process results. All input is managed through a single dialog as shown in the figure below. HEC-1 style inputs for selected basins and outlets is shown and a model checker can be run to verify that data is consistent and properly defined prior to actually running the model.

Figure 10. HEC-1 data not mapped through the shapefiles can be defined using a series of user-friendly dialogs.
The National Flood Frequency (NFF) program was compiled by cooperative effort between the United States Geological Survey, the Federal Highways Administration, and the Federal Emergency Management Agency. It contains a database of regional regression equations that can be used to compute peak discharges for 2, 5, 10, 25, 50, 100, and 500 year events. Watershed data such as area, slope, and median elevation are the primary variables used by most of the regression equations. The link between ArcView and WMS makes it a simple to access equations for any state/region in the US using data easily developed within the GIS. The dialog below illustrates how the interface in WMS is used to compute peak flows and runoff hydrographs with the regional regression equations.
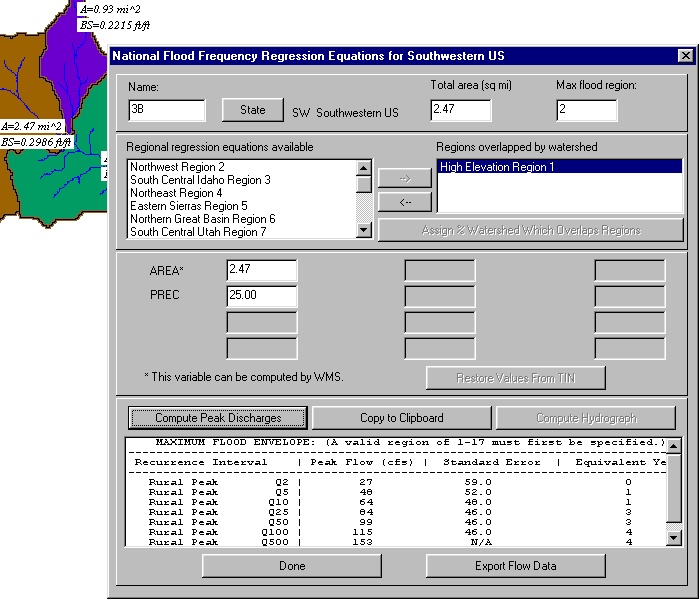
Figure 11. The National Flood Frequency (NFF) program contains state by state regional regression equations.
The Rational Method is one of the simplest and best known methods routinely applied in urban hydrology. Peak flows are computed from the simple equation:
Q = CiA
where:
Q - Peak flow
C - Runoff coefficient
i - Rainfall intensity
A - Catchment area
Both the catchment area, A, and the runoff coefficient, C, are easily computed using GIS. The rational method interface in WMS includes tools to generate intensity-duration-frequency curves to determine i, and several different dimensionless hydrograph methods that can be used for developing runoff hydrographs from peak flows. Routing lag times and level-pool routing through detention ponds can also be specified in order to develop runoff from a large catchment which has been subdivided into several smaller basins. The combination of a GIS such as ArcView and a hydrologic modeling system such as WMS provides a powerful method for analyzing urban drainage scenarios.

Figure 12. An interface to run the rational method can be used for urban hydrology problems.
TR-20, like HEC-1, is a lumped parameter, single event model that was developed by the National Resource Conservation Service (NRCS). Like HEC-1, data developed in ArcView can be passed to WMS using the three primary shapefiles and then remaining input parameters defined using a series of user-friendly dialogs. WMS will then create a properly formatted file and start the TR-20 executable. Results can be viewed in the same fashion as is with HEC-1.
WMS was initially developed as a surface modeling tool. Surface representation was in the form of triangulated irregular networks or TINs. Watershed and sub-basin boundaries can be determined from a TIN and all hydrologic parameters (area, slope, runoff distances, etc.) that can be computed from a TIN are done so automatically. These parameters are then used in conjunction with defining the models described above. Since WMS can import Arc/Info TINs, a TIN developed in the GIS can be used inside of WMS for hydrologic data development.

Figure 13. Black River Watershed (western New York state) delineated using a TIN.
Besides interfacing with ArcView and Arc/Info through shapefiles, WMS can be used for further hydrologic data development from grids. Two exported grids from either ArcView (export a grid as ASCII) or Arc/Info (use the GRIDASCII command) are required as input to WMS: 1) an elevation grid, and 2) a flow direction grid. Given these two grids WMS can be used to compute much of the same data as the scripts developed by ESRI to work inside of ArcView, including:
Computation of flow accumulation grid


Figure 14. Computed flow accumulation are automatically converted to stream lines.
User defined outlet locations and watershed and sub-basin delineation.

Figure 15. The combination of stream lines, specified outlet points, and a flow direction grid are used to delineate basins.
Computation of important hydrologic parameters such as area, average basin slope, maximum runoff distances, etc.

Figure 16. Basin parameters can be computed from delineate sub-basins for use in hydrologic models.
Raster watershed boundaries can be converted to polygons and exported as shapefiles (with accompanying computed attributes) for storage in a ArcView.
As with any of the watershed data developed in WMS, the hydrologic data developed can be used with any of the supported hydrologic models. Dean Thomas, a graduate assistant working with Dr. David Maidment at the University of Texas, successfully built an HEC-1 input file as part of an independent pilot study using these tools in a beta version of WMS.
Shapefiles representing Land Use and Hydrologic Soil Type can be imported into WMS and used in conjunction with a TIN to determine composite curve numbers and illustrated in the following diagrams. The same type of operation is also available for computing composite runoff coefficients when running the rational method.

Figure 17. Polygon shapefiles of soil type and land use can be used to create composite curve numbers.
Rainfall gage location with accompany time series can be imported into WMS through a separate data module. Values for rainfall from gages can then be in interpolated to a TIN or Grid for data visualization
If you are connected to the network you can view an animation from the WMS home pages.
Gage data can also be interpolated to basin centroids in order to create a separate time-varying distribution for each sub-basin being modeled with HEC-1.
More Information
More information, and a free demonstration version of WMS can be downloaded from the WMS home page. Pay attention to information on this site for availability and location where hydrologic modeling extension scripts for the ArcView Spatial Analyst can be downloaded.
More information on linking this tool to GIS can be found in a paper prepared by Dean Thomas

These materials may be used for study, research, and education, but please credit the authors and the Engineering Computer Graphics Laboratory, Brigham Young University. All commercial rights reserved. Copyright 1997 Engineering Computer Graphics Laboratory.