HECPREPRO is a GIS preprocessor for the Hydraulic Engineering Center's (HEC) Hydrologic Modeling System (HMS). HMS is currently being developed HEC as part of the NexGen program of research. The purpose of HECPREPRO is to summarize data from a GIS system so that they can be used as input for HMS. HECPREPRO takes a stream coverage, a subbasin coverage and an elevation grid as input data. The output data consists of an HMS basin file, a general text file, a DXF file and a 'hydrologic' and a symbolic coverage. The system is written in ARC/INFO's Arc Macro Language (AML) and is designed to run on a UNIX platform.
The system described here is a GIS preprocessor for lumped parameter hydrologic modeling programs. The system takes delineated watershed data in vector and raster format and translates it to a schematic data structure. This section introduces the schematic data model, followed by a description of the development of model.
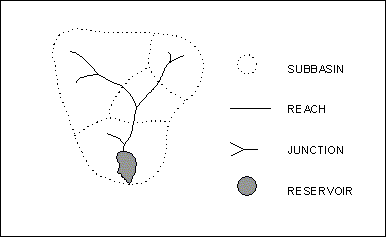
When a hydrologist constructs a model of the rainfall-runoff process in a watershed, he or she begins with a map of the region showing the layout of the stream system, land surface contours and other geographic features. Important locations on the stream system are located, such as the locations of stream gages or proposed structures. The drainage areas of these stream locations are delineated by tracing along the contour lines, at first directly uphill on each side of the stream until the ridge line of the watershed divide is reached, and then around the ridge line until a complete drainage area is found. Sometimes, additional drainage areas called subbasins are laid out within the watershed. Figure 1 is a typical example of this practice. Then, the hydrologist constructs a model schematic of the model elements that will describe the function of the system, as shown in Figure 2.

Figure 1. Geographic Layout of the Watershed.
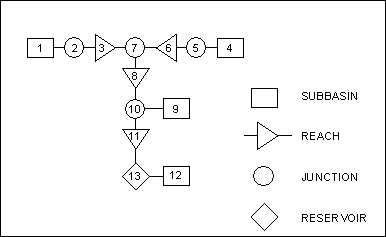
Figure 2. Schematic Diagram of the Watershed.
The model schematic shown in Figure 2 is an abstraction of geographic reality in a form suitable for hydrologic modeling. Each component in the schematic is assigned appropriate geographic description, such as an area of a subbasin or the length of a reach, and then the hydrologist focuses on the schematic model for the remainder of the investigation because that represents the abstraction used for hydrologic computation. This model schematic can be called a schematic model because it describes how things function as distinct from what they are and where they are as normally captured in GIS.
The schematic data model corresponds well with that of HMS. That system is developed using object-oriented programming. In this approach, each flow system such as a watershed, stream system, reservoir or stream junction is an object. Each type of object in HMS has an icon associated with it and the hydrologist builds on the screen a schematic diagram connecting these icons like that shown in Figure 2. The sequence of connectivity implied by this diagram signals to each object from which other object(s) it gets flow and thus the continuity of water movement between watersheds and stream channels is maintained. Each object has a parameter set associated with it containing its physical attributes or parameters derived from them, such as basin area, SCS curve number and unit hydrograph lag time. This graphical interface functions like a GIS building on a schematic data structure.
1.1.2. Development of Schematic Data Model.
The schematic model of the surface water hydrology of a region is comprised of seven types of hydrologic elements: Sources, Sinks, Subbasins, Reaches, Junctions, Diversions, and Reservoirs. The elements are defined in the following way. A region is defined spatially as an area enclosed by a single boundary line. which follows natural drainage divides such that drainage leaves the region as streamflow discharge at a finite number of outlet points called sinks, or outlets, O. Suppose further that there are a finite number of streams flowing into the region, and that each point where an inflowing stream crosses the region boundary is called a source or inlet, I. The region may be subdivided into subregions or subbasins, B, where the boundary of a subbasin is defined by drainage divides and the streamflow discharge from the subbasin occurs at one or more subbasin outlets. The streams flowing within the region can be mapped as a connected set of lines, each line being bounded by two nodes, one at each end of the line. Within the set of all streams, there is a subset called reaches, R, that are particularly critical in modeling the flow of water through the region because they carry downstream the water from region inlets and from subbasin outlets, and they carry the water to region outlets. Where two upstream reaches join to form a single downstream reach, there is located a point called a junction, J. Where one upstream reach divides to form two downstream reaches (as occurs in braided streams, or in river deltas), there is located a point called a diversion, D. At points on the reach network where water is impounded, a lake or reservoir, L, is located. Thus water flow through a region can be schematized as occuring in a set {B, D, I, J, L, O, R} of connected flow elements .
Spatially, four of the flow elements (inlets, outlets, junctions and diversions) are defined by points, reaches are defined by a line connecting two points, and subbasins and lakes are defined by areas. To simplify the representation of the flow through the elements, the two area elements are symbolized by points, located, respectively, at the centroid of a subbasin and at the outlet point of a lake or reservoir. Thus, the connectivity of the set of flow elements can be reduced to a simple point-line network, which is the basis for drawing the schematic diagram of the system. By using the GIS to determine the (x, y) coordinates of each point on this simplified network, the spatial layout of the network can be drawn to scale and superimposed upon the original stream and subbasin coverages of the region to visualize the relation between the model's flow elements and the geographic features they represent. By assigning a unique identifying number to each flow element, flow connectivity through the network can be defined by associating the element's indentifying number with those of its upstream and downstream elements. An object-oriented hydrologic model can then operate on each element as an individual object which obtains water from upstream objects and discharges it to downstream objects.
Knowing the (x,y) coordinates of each of the element points, and having a digital elevation model of the region defined as a rectangular mesh of elevation cells, the elevation of element points can be found as the elevation of the digital elevation model cell within which the point lies. Since the digital elevation model cells are very small (typically 100 meter cell size or less), in relation to the size of the model elements, the elevations so defined and the slopes between them are reasonably representative of the corresponding properties of the actual system. In this manner the point-line network of flow elements can be thought of as being suspended in a three-dimensional (x,y,z) space within the study region.
This manual is written to serve as a user's guide and reference manual. It provides documentation necessary to use the system including a detailed description of the input data in Section 2, a detailed description of the output data in Section 3 and information on how to use the system in Section 4. These sections are designed to be read by the user before the system is used.
To modify the system, expand or reproduce it in another programming environment the system methodology and procedure are discussed in detail in Section 5. The section is not designed to be read by the 'everyday user', bur rather to serve as a technical reference so that the system can be modified later if necessary.
AML programs are listed in Appendix A and sample output is presented in Appendix B.
In this manual a type convention as shown in Table 1.3 is used.
Type              Convention                   Example

Commands          system COMMAND command       arc UNGENERATE command
Functions         system FUNCTION function     grid INT function
Directives        system DIRECTIVE directive   AML &SV directive
Single Variable   variablename                 hecid
Array Variable    arrayname(n)                 hecx(34)
Matrix Variable   matrixname(n, m)             hecupid(2,56)
Data File         datafile                     streamcov.nat
Table Item        table//item                  hydrocov.nat//hecid
Go to: Short Table of Contents, Long Table of Contents, HECPREPRO Page.
This section describes the input data requirements in detail. As input a stream coverage, subbasin coverage and elevation grid are required. Those data sets have to be in the same projection and datum. The input data has to accurately describe the hydrologic properties of the area. Where errors occur they are due to discrepancies among the stream and subbasin coverages. An example of an error in the input data is shown in Figure 2.1. There a stream is zigzagging across the subbasin boundary. Another example of an error is shown in Figure 2.2. There Grid routines were used to delineate the basin boundary. Subsequent conversion from grid to coverage created the small enclosed subbasin at the right basin boundary. That is an error commonly encountered on a small scale. Those errors have to be corrected before running the system. For this purpose the ARC/INFO ArcEdit module provides for a suitable editing environment.
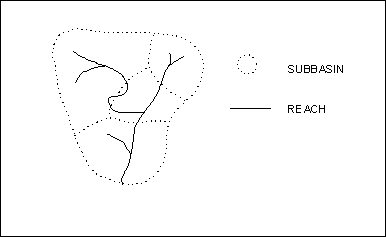
Figure 2.1. First Example of Error in Input Data.
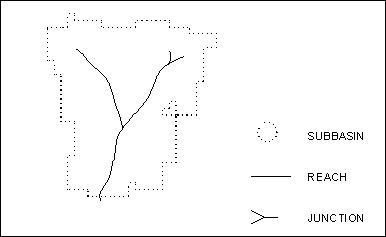
Figure 2.2. Second Example of Error in Input Data.
The following sections describe specific input data requirements for each of the three data sets.
This section describes the output data in detail. The output data contains of a HMS basin file, a general text file, a DXF file and a 'hydrologic' and a symbolic coverage.
The HMS basin file is an ASCII file designed to be read by HMS directly. Parts of a HMS basin file is presented in Figure 3.1.
Basin: HECPREPRO generated HMS basin file
     Description: HECPREPRO generated HMS basin file
     Last Modified Date: 10 June 1996
     Last Modified Time: 12:58
     Unit System: Unknown
End:

Subbasin:  23
     Canvas X:  115488.609
     Canvas Y:  1455012.500
     Downstream:  7
     Area:  845179044
End:

.
.
.

Source:  1
     Canvas X:  169282.81250
     Canvas Y:  1462399.39734
     Downstream:  12
End:

.
.
.

Reach:  12
     Downstream:  2
End:

.
.
.

Junction:  2
     Canvas X:  127482.82031
     Canvas Y:  1454141.12500
     Downstream:  13
End:

.
.
.

Reservoir:  5
     Canvas X:  99024.17188
     Canvas Y:  1438141.12500
     Downstream:  16 15
End:

.
.
.

Diversion:  9
     Canvas X:  93124.17188
     Canvas Y:  1406660.84829
     Downstream:  20 21
End:

.
.
.

Sink:  11
     Canvas X:  85182.82031
     Canvas Y:  1393441.12500
End:
The general text file is in ASCII format. The file lists the hydrologic elements and their attributes by element type. The data written to the output file is listed in Table 3.1. An example output file is presented in Appendix B.
Element        Attributes

Subbasin       I.D., coordinates of centroid, elevation of centroid,
               coordinates of subbasin boundary, coordinates of longest
               flow path, elevation of upstream end of longest flow path,
               length of longest flow path, length along longest flow
               path from point nearest to subbasin centroid to subbasin
               outlet, area, mean surface slope, median surface slope,
               I.D. of downstream element.

Source         I.D., coordinates, elevation, I.D. of downstream element.

Reaches        I.D., length, slope, I.D. of upstream element, I.D. of
               downstream element.

Junctions      I.D., coordinates, elevation, I.D. of upstream element(s),
               I.D. of downstream element.

Reservoirs     I.D., coordinates, elevation, I.D. of upstream element(s),
               I.D. of downstream element(s).

Diversions     I.D., coordinates, elevation, I.D. of upstream element,
               I.D. of downstream element(s).

Sinks          I.D., coordinates, elevation, I.D. of upstream element(s).
The system can create an AutoCAD Drawing Exchange File (DXF) of the streams and the subbasins. The file is in ASCII format. It contains the 'streams' and 'subbasins' layers. The beginning of a DXF file is presented in Figure 3.2.
0
SECTION
  2
HEADER
  9
$EXTMIN
 10
74724.17
 20
1376741.13
  9
$EXTMAX
 10
177024.17
 20
1484841.13
  9
$LUPREC
 70
    14
  0
ENDSEC
  0
SECTION
  2
TABLES
  0
ENDSEC
  0
SECTION
  2
BLOCKS
  0
ENDSEC
  0
SECTION
  2
ENTITIES
  0
POLYLINE
  8
streams
 66
     1
  0
VERTEX
  8
.
.
.
A 'hydrologic' coverage (hydrocov) is created. The main purpose of the coverage is to serve as a working coverage to store data and perform calculations during the program run. However, the coverage is also useful for trouble shooting purposes. See the discussion on viewing results in Section 4.5.
Hydrocov is an ARC/INFO line coverage of the streams. The coverage is the same as input stream coverage except that it has nodes at the intersections with the lines of the subbasin coverage. It contains node, line and polygon topology. Figure 3.3 shows an example of a hydrocov and Table 3.2 lists and describes the attribute data structure.
Figure not available.
Figure 3.3. Example Hydrologic Coverage.
Attribute      Item            Description
Table

hydrocov.nat   arc#            # of one connected line
               hydrocov#       # of node
               hydrocov-id     id of node
               x-coord         x coordinate of node*
               y-coord         y coordinate of node*
               hectype         feature hectype
               hecid           unique identification number
               hecupid         hecid of upstream element
               hecdnid         hecid of downstream element
               nodez           node surface elevation*

hydrocov.aat   fnode#          # of from-node
               tnode#          # of to-node
               lpoly#          # of left-polygon
               rpoly#          # of right-polygon
               length          length of line*
               hydrocov#       # of line
               hydrocov-id     if of line
               streamcov#      # of corresponding line in stream
                               coverage
               streamcov-id    id of corresponding line in stream
                               coverage
               hectype         feature hectype
               hecid           unique identification number
               hecupid         hecid of upstream element
               hecdnid         hecid of downstream element
               heclength       length of reach*
               hecslope        slope of reach*
               subcov#         # of corresponding polygon in
                               subbasin coverage
               area            area of corresponding polygon in
                               subbasin coverage*
               perimeter       perimeter of corresponding polygon in
                               subbasin coverage*
               subcov-id       id of corresponding polygon in
                               subbasin coverage
               cenz            not valued
               means           not valued
               medians         not valued
               b-coord         not valued
               f-coord         not valued
               fupz            not valued
               flength         not valued
               flength2        not valued

hydrocov.pat   area            area of polygon*
               perimeter       perimeter of polygon*
               hydrocov#       # of polygon
               hydrocov-id     id of polygon
Table 3.2. Hydrologic Coverage Attribute Items.
A symbolic coverage (symcov) is created. The main purpose of the coverage is for the user to check the results of the system. See the discussion on viewing results in Section 4.5.
Symcov is an ARC/INFO line coverage. The lines in the coverage either represent reaches or links. The nodes in the coverage represent channel elements. The coverage contains node and line topology. Figure 3.4 shows an example of a symcov and Table 3.3 lists and describes the attribute data structure.
Figure not available.
Figure 3.4. Example Symbolic Coverage.
Attribute      Item            Description
Table

symcov.nat     arc#            # of one connected line
               symcov#         # of node
               symcov-id       id of node
               hecid           unique identification number

symcov.aat     fnode#          # of from-node
               tnode#          # of to-node
               lpoly#          # of left-polygon
               rpoly#          # of right-polygon
               length          length of line*
               symcov#         # of line
               symcov-id       id of line
               hecid           unique identification number
               uphecid         hecid of from-node
               dnhecid         hecid of to-node
Table 3.3. Symbolic Coverage Attribute Items.
Go to: Short Table of Contents, Long Table of Contents, HECPREPRO Page.
The system consist of the following five AML programs:
The programs can be downloaded via anonymous ftp from:
ftp.crwr.utexas.edu/pub/crwr/gishydro/hecprepro/
The main program is called hecprepro.aml. It can be started from the arc command line using the AML &RUN directive. The names of the three input data sets have to be specified at the command line. Other optional information, like the name of the general text file, can also be specified at the command line. If the optional information is not specified it is assigned default values. Box 4.1 shows the syntax for starting the system with input stream coverage 'mystreams', input subbasin coverage 'mysubs', input elevation grid 'myelev' and user observation level 3. Table 4.1 summarizes the command line input. A more detailed discussion of the purpose of the individual variables follows later in this section.
Arc: &run hecprepro.aml mystreams mysubs myelev 3
Variable Name      Description                    Required       Default

streamcov          Stream Line coverage           Yes            --
subcov             Subbasin Polygon Coverage      Yes            --
elevgrid           Elevation Grid                 Yes            --
.oblevel*          User Observation Level         No             2
attrib             Attribute Collection?          No             Yes
clipped            Prior Clipping?                No             Yes
snapit             Node Snapping?                 No             No
snaptol            Snapping Tolerance Distance    No             0
outfile            Name of Output File            No             hecprepro.out
dxffile            Create DXF File                No             No
dxfname            Name of DXF File               No             dxfout.dxf
hmsfile            Create HMS Basin File          No             No
hmsname            Name of HMS Basin File         No             hmsbasin.txt
Table 4.1. Command Line Input.
To facilitate the usage of the system a shell program called hecshell.aml is available. Hecshell.aml interactively prompts the user for the value of each individual variable. With hecshell.aml the user also has the option to run the system with the previous inputs or enter new inputs. If the user decides to enter new inputs the previous inputs will appear as defaults. Box 4.2. shows part of the syntax for starting the system with hecshell.aml.
Arc: &run hecshell.aml
HECPREPRO:
HECPREPRO: -----------------------
HECPREPRO: -----------------------
HECPREPRO: --- HECPREPRO SHELL ---
HECPREPRO: -----------------------
HECPREPRO: -----------------------
HECPREPRO:
HECPREPRO:
HECPREPRO: ----------------------------------
HECPREPRO: --- Same Data as Previous Run? ---
HECPREPRO: ----------------------------------
HECPREPRO:
HECPREPRO: Description:
HECPREPRO: The program can be run with the same input as the
HECPREPRO: previous run.  The previous input variables were:
HECPREPRO:
HECPREPRO: Stream Coverage: tkst2
HECPREPRO: Subbasin Coverage: tksub
HECPREPRO: Elevation Grid: tkelev
HECPREPRO: User Observation Level: 0
HECPREPRO: Attribute Collection? Yes
HECPREPRO: Clipped? No
HECPREPRO: Node Snapping? No
HECPREPRO: Snapping Tolerance Distance: 0
HECPREPRO: Name of General Text File: hecprepro.out
HECPREPRO: DXF File? no
HECPREPRO: Name of DXF File: dxfout.dxf
HECPREPRO: HMS Basin File? yes
HECPREPRO: Name of HMS Basin File: hmsbasin.txt
HECPREPRO:
HECPREPRO: Valid Responses:
HECPREPRO: Y - same data will be used
HECPREPRO: N - same data will not be used (default)
HECPREPRO:
HECPREPRO: Same Data as Previous Run?: n
HECPREPRO:
HECPREPRO: -----------------------
HECPREPRO: --- Stream Coverage ---
HECPREPRO: -----------------------
HECPREPRO:
HECPREPRO: Description:
HECPREPRO: The stream coverage has to have all the arcs pointing
HECPREPRO: downstream.  Polygons are considered reservoirs.
HECPREPRO:
HECPREPRO: Valid Responses:
HECPREPRO: The name of a stream coverage
HECPREPRO:
HECPREPRO: Stream Coverage <tkst2>: tkst1
HECPREPRO:
HECPREPRO: -------------------------
HECPREPRO: --- Subbasin Coverage ---
HECPREPRO: -------------------------
HECPREPRO:
HECPREPRO: Description:

.
.
.

HECPREPRO:
HECPREPRO: Starting HECPREPRO ...
HECPREPRO:
HECPREPRO:
HECPREPRO: -----------------------
HECPREPRO: --- HECPREPRO START ---
HECPREPRO: -----------------------
HECPREPRO:
.
.
.
The system can be run with different user observation levels, which control how often the program will pause for user observation. Table 4.2. lists the possible user observation levels.
User Observation   Description
Level

General
0                  no pause and no graphic display (for background
                   running)
1                  pause at error
2                  pause at error and legends (default)
3                  first level debug
4                  second level debug

Special
0.20, 0.30, etc.   Makes first pause at Step 2, Step 3, etc.
9                  Quits instantly (entered at pause only)
When the program pauses for user observation the user can continue by pressing 'RETURN' or entering a new user observation level. If the user enters a '9' the program will quit instantly. Box 4.3 shows an example of a user observation level pause and a subsequent change to a user observation level 2.
.
.
.
Killed MEDIANSGRID with the ALL option
HECPREPRO:
HECPREPRO: Calculating subbasin median slopes
HECPREPRO:
Running... 100%
Percentage of Cells Processed: 100%
Feature cursor CUR1020 now declared using file
 SUBCOV.PAT with Read Write access
Feature cursor CUR1020 now opened with
5 reselected records out of 5
Fetched record 1 for Feature cursor CUR1020
Fetched record 2 for Feature cursor CUR1020
HECPREPRO:
HECPREPRO: Recording CENZ, MEANS and MEDIANS for subbasin
HECPREPRO: POLY: 2
HECPREPRO: CENZ: 365
HECPREPRO: MEANS: 3.17241
HECPREPRO: MEDIANS: 1.677
HECPREPRO:
HECPREPRO:<Return> or new observation level to continue: 2
.
.
.
There are several advanced options as discussed below.
4.4.1. Attribute Collection Option.
The program structure is based on establishing hydrologic elements and connectivity among them. It is therefore possible to run the system without collecting attributes. That means the program will bypass operations not needed to establish hydrologic elements and connectivity among them. For example, for each hydrologic element the general text file will only contain I.D., I.D. of upstream element(s) and I.D. of downstream element(s). Other data as shown in Table 3.1 is not written to the file.
Most errors in the input data produce significant errors when establishing connectivity among elements. Not collecting attributes might be desirable for the first system run.
It is possible that the subbasin coverage was used to clip the stream coverage from a larger stream coverage. This requires a more thorough procedure for establishing source, sink and subbasin outlet elements. See Section 5.2 for detailed information.
The more thorough procedure is computationally more intensive and therefore increases program running time. However, if a doubt exists about the input data it should be chosen.
In Section 2 it was mentioned that the stream and subbasin coverages had to accurately represent the hydrologic properties of the area. This condition applies on every scale, all the way down to the fuzzy tolerance of the coverages. Consider for example Figure 4.1. There Grid routines were used to delineate subbasin boundaries from an intersection in the stream coverage. However, the relatively coarse grid cell size caused the subbasin boundaries to be slightly offset from the stream junction. When constructing a schematic data model as discussed in Section 1.1 the result would be as shown in Figure 4.1. Obviously this was not the intent.
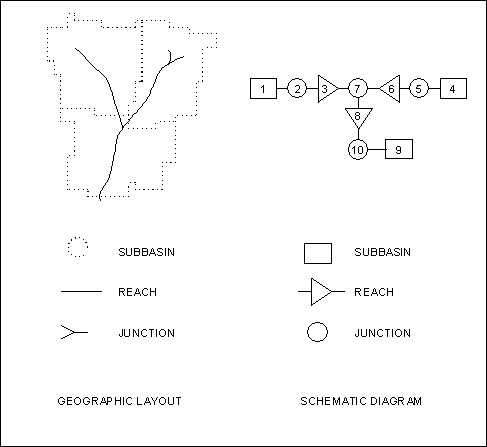
Figure 4.1. Example Input Data where Node Snapping is Applicable.
To correct this problem, the nodes of the stream coverage (e.g. junctions) can be snapped to nodes of the subbasin coverage before the schematic data model is constructed. Figure 4.2 shows the same watershed and resulting schematic data model after node snapping was performed.
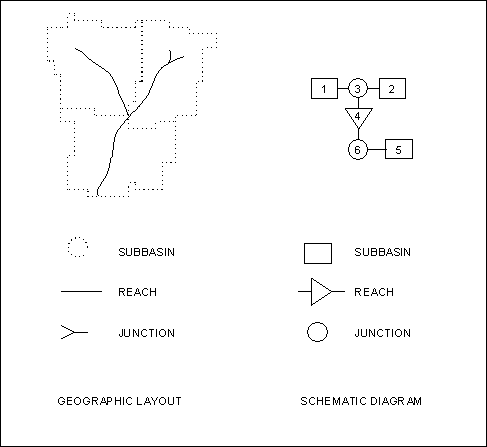
Figure 4.2. Example Input Data after Node Snapping.
When node snapping is to be performed it is required to enter a snapping tolerance distance, which specifies the maximum distance used for node snapping. If the discrepancies in the input data are due to delineation with Grid routines it is recommended that a tolerance of three times the grid cell size is used.
4.5.1. General Text File, HMS Basin File and DXF File.
The general text file, HMS basin file and DXF file are in ASCII format and can be viewed with any text editor or word processor.
The hydrologic coverage (hydrocov) can be displayed along with the subbasin coverage with the hechydro.aml program. The program will mark different element types with different symbols and display a legend in the command line window. The legend is presented in Box 4.4.
HECPREPRO:
HECPREPRO: HYDROCOV LEGEND:
HECPREPRO: -------------------------------------------------
HECPREPRO:
HECPREPRO: LINES:
HECPREPRO: White:  Subbasin Boundary and Streams Outside
HECPREPRO:         Watershed Boundary
HECPREPRO: Yellow: Channel System
HECPREPRO: Red:    Non Channel System
HECPREPRO: Cyan:   Reservoir Shoreline
HECPREPRO:
HECPREPRO: SYMBOLS:
HECPREPRO: Green Triangles:           Subbasin Outlets
HECPREPRO: Red Triangles:             Sinks
HECPREPRO: Blue Triangles:            Sources
HECPREPRO: Green Circles:             Junctions
HECPREPRO: Blue Circles:              Diversions
HECPREPRO: Green Boxes:               Subbasins
HECPREPRO: Upsidedown Green Triangle: Reservoirs
HECPREPRO: Blue Dot:   Upstream End of Longest Flow Path
HECPREPRO: Yellow Box: Point on Longest Flow Path closest to
HECPREPRO:             Subbasin Centroid.
HECPREPRO:
HECPREPRO: TEXT:
HECPREPRO: White:  HECID of Channel Elements
HECPREPRO: Yellow: HECID of Reaches
HECPREPRO: Cyan:   HECDNID of Elements
HECPREPRO:
HECPREPRO: -------------------------------------------------
HECPREPRO:
This hechydro.aml program is useful for troubleshooting hydrocov. The user can zoom into an area of interest using the arcplot MAPEXTEND command. Hydrocov is then easily redisplayed by running the hechydro.aml with the arcplot &RUN directive.
The symbolic coverage (symcov) can be displayed along with the subbasin coverage with the hecsym.aml program. The program works similar to hechydro.aml. It will mark different element types with different symbols and display a legend in the command line window. The legend is presented in Box 4.5.
HECPREPRO:
HECPREPRO: SYMCOV LEGEND:
HECPREPRO: -----------------------------------------
HECPREPRO:
HECPREPRO: LINES:
HECPREPRO: White:  Input Stream and Subbasin Lines
HECPREPRO: Green:  Reaches
HECPREPRO: Yellow: Links
HECPREPRO:
HECPREPRO: SYMBOLS:
HECPREPRO: Squares:              Subbasins
HECPREPRO: Stars:                Sources
HECPREPRO: Triangles:            Junctions
HECPREPRO: Upsidedown Triangles: Reservoirs
HECPREPRO: Circles:              Diversions
HECPREPRO: Diamonds:             Sinks
HECPREPRO:
HECPREPRO: TEXT:
HECPREPRO: Yellow: HECID of Elements
HECPREPRO:
HECPREPRO: -----------------------------------------
HECPREPRO:
HECPREPRO: General Text File: hecprepro.out
HECPREPRO: DXF File:          dxfout.dxf
HECPREPRO:
HECPREPRO: -----------------------------------------
HECPREPRO:
The hecsym.aml program is useful for checking the output of the system. The user can zoom into an area of interest using the arcplot MAPEXTEND command. Symcov is then easily redisplayed by running the hecsym.aml.
Go to: Short Table of Contents, Long Table of Contents, HECPREPRO Page.
This section outlines the methodology and procedure of the system. It is intended to document the system so that it can be modified, expanded or reproduced in another programming environment. In general the procedure is based on establishing the seven hydrologic elements and connectivity among them as discussed in Section 1.1. Attributes are collected and summarized where applicable, usually where the information is at hand.
The section numbering system used in this discussion is consistent with that in the program code. AML programs are listed in Appendix A. For clarity several parts of the system procedure are omitted in this discussion. They are:
To keep the scope of the discussion manageable several repeated methods are also omitted in the discussion. They are:
The first step in the procedure is to prepare the input data for processing. This consists of such things as managing the command line input, making working copies of the coverages and adding working items to the attribute files.
5.1.1. Manage Command Line Input.
Nine variables are communicated to the program over the command line using the AML &ARGS directive. Only the first three variables specifying the input data sets are required. Other variables will be assigned default values if not specified. See Section 4.1 for details on the command line input.
5.1.2. Make Working Copies of Input Data Sets.
Working copies of the stream and subbasin coverages (streamcov and subcov) are made using the arc COPY command. This is done so that the original data is not modified. Previously existing versions of streamcov or subcov are deleted using the arc KILL ALL command. A working copy of the elevation grid is not made, because it is not modified.
5.1.3. Create Grid of Subbasins.
A subbasin grid (subgrid) is created from subcov using the arc POLYGRID command. The same cell size as in the elevation grid is used. This grid is used later in the program to find the mean and median surface slope of each subbasin. If necessary, previously existing versions of subgrid are deleted using the arc KILL ALL command.
Node and line topology are created for streamcov, and node, line and polygon topology are created for subcov using the arc BUILD command. Topology is essential for defining connectivity among features. Polygon labels of subcov are moved to the centroid of the polygons using the arc CENTROIDLABELS command and the xy coordinates of the labels are added to the subcov polygon attribute table (subcov.pat) using the arc ADDXY command. XY coordinates of the subbasin centroids are needed, because the subbasin location is defined at that point.
5.1.5. Add Working Items to INFO Files.
Several working items are added to the attribute tables of streamcov and subcov using the arc ADDITEM command. Description of attribute items are presented in Table 5.1. Table 5.2 shows how the items are defined.
Attribute      Item            Description
Table

streamcov.nat  hectype         feature hectype
               hecid           unique identification number
               hecupid         hecid of upstream element
               hecdnid         hecid of downstream element
               nodez           node surface elevation*

streamcov.aat  hectype         feature hectype
               hecid           unique identification number
               hecupid         hecid of upstream element
               hecdnid         hecid of downstream element
               heclength       length of reach*
               hecslope        slope of reach*

subcov.pat     hectype         feature hectype
               hecid           unique identification number
               hecdnid         hecid of upstream element
               cenz            hecid of downstream element
               means           mean surface slope*
               medians         median surface slope*
               b-coord         name of file holding coordinates of
                               subbasin boundary
               f-coord         name of file holding longest flow
                               path coordinates
               fupz            elevation of upstream end of longest
                               flow path*
               flength         length of longest flow path*
               flength2        length along longest flow path from
                               point nearest to subbasin centroid to
                               subbasin outlet*
Table 5.1. Working Item Description.
Attribute      Item            Width      Output    Type       Decimal
Table                                     Width                Places

streamcov.nat  hectype         4          4         i          --
               hecid           4          4         i          --
               hecupid         4          4         i          --
               hecdnid         4          4         i          --
               nodez           8          8         f          2
               upnode          4          4         i          --

streamcov.aat  hectype         4          4         i          --
               hecid           4          4         i          --
               hecupid         4          4         i          --
               hecdnid         4          4         i          --
               heclength       8          8         f          2
               hecslope        8          8         f          6

subcov.pat     hectype         4          4         i          --
               hecid           4          4         i          --
               hecdnid         4          4         i          --
               cenz            8          8         f          2
               means           8          8         f          6
               medians         8          8         f          6
               b-coord         8          8         c          --
               f-coord         8          8         c          --
               fupz            8          8         f          2
               flength         8          8         f          2
               flength2        8          8         f          2
The hectype is used to classify the features according to the hectype system. The hectype system is a more thorough classification system than the seven element system. It is needed, because the seven element system is not detailed enough to establish connectivity among hydrologic elements. For example: In the seven element system, a reach confluence and a subbasin outlet are both classified as junctions. When establishing element connectivity it is important to know if the element is a subbasin outlet, because there will have to be a corresponding subbasin element. Table 5.3. lists the possible hectypes.
Hectype      Description

-1           unknown
0            not used
1            subbasin outlet
2            non-channel element*
3            junction
4            channel element*
5            subbasin
6            sink
7            source
8            diversion
9            not used
10           reservoir
Table 5.3. Hectype Description.
The hecid is a unique identification number for each hydrologic element which is assigned by the system. The hecupid and hecdnid items are used for storing the hecid of the upstream and downstream hydrologic elements, respectively. Hydrologic elements adjacent to one-another can be represented by two nodes (e.g. subbasin and junction) or a node and a line (e.g. diversion and reach).
5.1.6. Mark Elements as Unknown Hectype.
All the lines and nodes in streamcov are marked as unknown hectype by setting streamcov.nat//hectype and streamcov.aat//hectype of all records to -1.
Figure 5.1. shows an example of the input data.
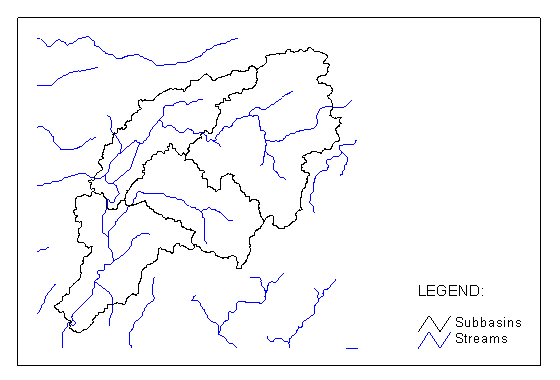
Figure 5.1. Example Input Data.
5.2. Establish Source, Sink and Subbasin Outlet Elements.
The first elements that are established are sources, sinks and subbasin outlets. Those elements are located on streams where they intersect with the subbasin boundaries. The simplest way to establish these elements is to intersect the stream and subbasin coverages. Nodes representing sources, sinks and subbasin outlet elements can then be differentiated from other nodes based on having been created by the intersection action.
In some cases the stream coverage already contains nodes representing sources, sinks and subbasin outlets near intersections with the subbasin boundaries. This would be the case if the subbasins were delineated from the stream coverage using Grid routines. An option is provided to snap nodes from the stream coverage to nodes from the subbasin coverage. See the discussion in Section 4.4.3. In that case, nodes representing sources, sinks or subbasin outlets could have existed before the intersection. Nodes representing sources, sinks and subbasin outlet elements can then be differentiated from other nodes based on having been created by the intersection or based on having been snapped.
It is also possible that the subbasin coverage was used to clip the stream coverage from a larger stream coverage. See the discussion in Section 4.4.2. In that case the only way to determine source, sink and subbasin outlet elements is to look at each node of the stream coverage and determine if it is located at an intersection with the subbasin coverage.
Streamcov is intersected with subcov to create a new coverage (hydrocov) using the arc INTERSECT command. Box 5.1. shows the arc syntax. The resulting hydrocov is the same as streamcov except that it has nodes at the intersections with the subcov lines. These nodes are sink, source or subbasin outlet elements.
Intersect streamcov subcov hydrocov line # join
The 'join' parameter in the syntax adds items from subcov.pat to hydrocov.aat if they do not already exist in hydrocov.aat. This means that there will be a subcov# item in hydrocov.aat specifying the polygon the line is located in. That information is used later to establish connectivity among subbasins and the channel system. If necessary, a previously existing hydrocov is deleted using the arc KILL ALL command.
These newly created nodes have 'empty' attribute values, which means they will have a hectype 0. That is the key to distinguishing them from the original nodes which were previously assigned a hectype -1 (Section 5.1.6). The source, sink and subbasin outlet elements can therefore distinguished based on having a hydrocov.nat//hectype 0 instead of -1
If specified with the snapit variable, nodes in hydrocov within a certain distance (snaptol) of nodes in subcov are snapped to nodes in subcov using the arcedit SNAP command.
After the node snapping there could be nodes representing sources, sinks and subbasin outlets which existed prior to the intersection. Those nodes can not be distinguished from the other nodes based on hectype, because they have a hectype -1. To identify sources, sinks and subbasin outlet elements the nodes that were snapped have to be distinguished from the other nodes. This is made possible by adding the 'snapped' item to subcov.nat and hydrocov.nat, and setting subcov.nat//snapped to 1. It is then specified that the value of the snapped item will be transfered among snapped features with the arcedit SNAPITEMS command. This way all the nodes that were snapped will have hydrocov.nat//snapped equal to 1. The ARC/INFO syntax is shown in Box 5.2.
arcedit
edit hydrocov
editfeature arc
snapcoverage subcov
snapfeatures node node
mape subcov
snapping closest snaptol
snapitems snapped
aselect all
snap
save
q
5.2.3. Set Up Hydrocov for Further Processing.
Line, node and polygon topology for hydrocov is created using the arc CLEAN and BUILD commands. This is needed, because the coverage was modified by the intersection and possibly the node snapping. XY coordinates of the nodes are added to hydrocov.nat using the arc ADDXY command. XY coordinates are needed, because they define the location of the elements.
5.2.4. Calculate Surface Elevation Attributes.
A new grid (slopegrid) storing the surface slope (in percent) is created from the elevation grid using the grid SLOPE function. Two new grids (meansgrid and mediansgrid) storing the mean and median surface slopes for each subbasin are created from slopegrid and polygrid using the grid ZONALMEAN and ZONALMEDIAN functions. The grid ZONALMEDIAN function only operates on integer grids. Slopegrid is not an integer grid. The grid INT function is therefore used in conjunction with the grid ZONALMEDIAN function. Since the grid INT function rounds values to the nearest integer, slopegrid is multiplied by 1000 to reduce the degree of accuracy lost during the operation. This means mediansgrid actually stores the median slope times 1000. If necessary, previously existing slopegrid, meansgrid and mediansgrid grids are deleted using the arc KILL ALL command. Box 5.3. lists the grid syntax.
slopegrid = slope (elevgrid,percentrise)
meansgrid = zonalmean (subgrid,slopegrid,#)
mediansgrid = zonalmedian (subgrid, INT (slopegrid * 1000), #)
Each polygon in subcov, except the universal one around the watershed perimeter, is then processed. The AML SHOW function is used along with the grid CELLVALUE command to determine the elevation (elevation grid) at the centroid and the mean (meansgrid) and median (mediansgrid) surface slope for each subbasin. The value from mediansgrid is divided by 1000. The elevation, mean slope and median slope values are written to subcov.pat//cenz, means and medians, respectively.
5.2.4.2. Stream Node Attributes.
Each node in hydrocov is processed. The AML SHOW function is used along with the grid CELLVALUE command to determine the elevation of each node. The elevation is written to hydrocov.nat//nodez and an array (nodez(node)).
5.2.5. Establish Sources, Sinks and Subbasin Outlets.
So far the identification of source, sink and subbasin elements depends on them being created by the intersection of streamcov with subcov or having been snapped to nodes in subcov. The system can also determine source, sink and subbasin outlet elements for the case that the stream coverage was clipped or intersected with the subbasin coverage before the program is run. This is specified with the clipped variable. Sinks, sources and subbasin outlets are established by looking at all the nodes in hydrocov and determining if there are actually lines from subcov at that location.
Each node in hydrocov is processed. The xy coordinates of the node are used along with the arcplot ASELECT command to attempt to select a line from subcov. Prior to the attempt the search tolerance is set to 10 with the arcplot SEARCHTOLERANCE command. If in fact a subcov line gets selected the hydrocov node is located at an intersection and is therefore a source, sink or subbasin outlet element. If that is the case the node gets marked by setting hydrocov.nat//hectype to 0, which is the same hectype as nodes created by the intersection.
5.2.5.2. Record Data and Create Selection File.
Source, sink and subbasin outlet nodes are selected from hydrocov. The nodes are identified by having hydrocov.nat//hectype 0 or hydrocov.nat//snapped 1 (only checked if node snapping was actually done). The arcplot WRITESELECT command is used to write the selection set to a file and the hydrocov.nat//hectype is set to 1 for the selection set.
Figure 5.2 shows an example of the data after source, sink and subbasin outlet elements have been established.
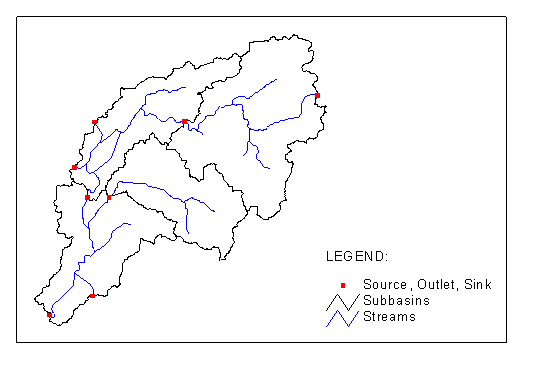
Figure 5.2. Example of Established Source, Sink and Subbasin Outlet Elements.
5.3. Establish Channel System.
Stream lines are classified into two general types. Stream lines can be part of the channel system that carries water from upstream features (channel system) or they can be tributaries to the channel system (non-channel system). Further, lines are distinguished based on being part of a reservoir defined by double-line connections between two stream nodes.
The channel system is defined by being downstream of hydrologic elements. There is always a source or a subbasin outlet at the upstream ends of the channel system. That means that the channel system can also be defined by being downstream of sources, sinks and subbasin outlets. The system identifies the channel system by tracing downstream of the source, sink and subbasin outlet nodes established previously. Reservoir lines are identified by being enclosed polygons in the stream coverage.
All the nodes and lines in hydrocov are selected and the arcplot TRACE command is used along with the selection file specifying source, sink and subbasin outlet nodes to identify the nodes and lines downstream of the source, sink and subbasin outlet nodes. The arcplot TRACE command automatically writes the traced features to a selection file. The features in that selection file represent the channel system.
The channel system is selected using the arcplot READSELECT command and sources, sinks and subbasin outlets (hydrocov.nat//hectype 1) are removed from the selection set. The channel system nodes (except source, sink and subbasin outlet) and lines are marked by setting hydrocov.nat//hectype and hydrocov.aat//hectype to 4.
The selection set is switched and the sources, sinks and subbasin outlets are again removed from the selection. The non-channel system lines and nodes are marked by setting hydrocov.nat//hectype and hydrocov.aat//hectype to 2.
Figure 5.3 shows an example of the data after the channel system has been established.
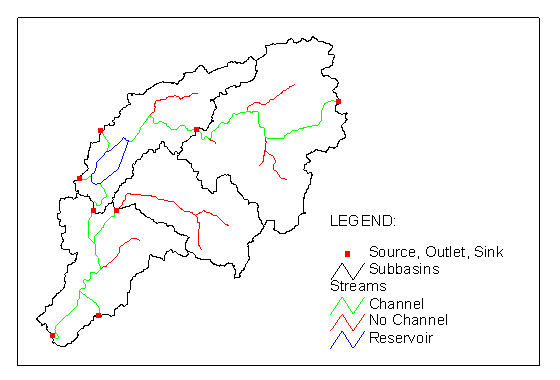
Figure 5.3. Example of Established Channel System.
5.4. Establish Channel Elements.
The hydrologic element represented by each node (seven element and hectype system) can now be identified by it's relation to other elements. General ARC/INFO node, line and polygon topology is however insufficient for this purpose, because it does not directly provide information on how each node relates to connecting lines. That information is vital for determining the hydrologic element type of a node. For example: A node having multiple upstream lines is defined as a junction; a node having multiple downstream lines is defined as a diversion; etc.
Therefore, the ARC/INFO topology is expanded to include information on how each node relates to connecting lines. That information is stored as 'node type'. Possible node types are shown in Figure 5.4 and listed in Table 5.4.
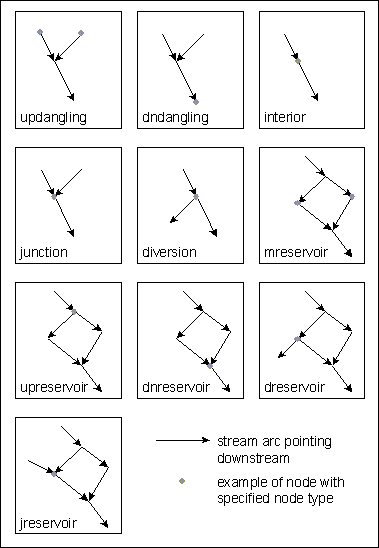
Figure 5.4. Node Type Illustration.
Node Type          Description

unknown            unknown
none               none
updangling         a node at the upstream end of a dangling line.
dndangling         a node at the downstream end of a dangling line.
interior           a node connecting two lines pointing in the same
                   direction (a pseudo node).
junction           a node which has multiple lines pointing towards it and
                   one line pointing away.
diversion          a node which has multiple lines pointing away from it
                   and one line pointing towards it.
mreservoir         a node connecting two lines along a reservoir pointing
                   in the same direction (a pseudo node).
mpreservoir        a node at the most upstream end of a reservoir
dnreservoir        a node at the downstream end of a reservoir.
dreservoir         a node at a reservoir diversion.
jreservoir         a node at a reservoir junction.
Each node has two node types. One node type (rnodetype) is calculated taking into account all the lines in hydrocov. Another node type (hnodetype) is calculated taking into account only lines belonging to the channel system. Consider, for example, the subbasin in the upper right corner of Figure 5.3. When taking into account all the lines there are four 'junctions' whereas when taking into account only lines from the channel system there are only 'interior' nodes.
5.4.1. Create Hydrotopolgy Arrays.
The first step in building this extended topology is to create arrays storing the number of lines upstream and downstream of each node. These arrays are termed hydrotopology arrays. A line is defined as being upstream or downstream of a node by having that node as tnode or fnode respectively. In this step it is differentiated among (1) lines that are part of the channel system and those that are not, and (2) lines that are part of a reservoir and lines that are not. That information is stored in the arrays listed in Table 5.5.
Hydrotopology Array      Description

r#nodes(node)            number of lines that have this node as tnode or
                         fnode.
r#fnodes(node)           number of lines that have  this node as fnode.
r#tnodes(node)           number of lines that have this node as tnode.
r#rnodes(node)           number of reservoir lines that have this node as
                         tnode or fnode.
r#rfnodes(node)          number of reservoir lines that have this node as
                         fnode.
r#rtnodes(node)          number of reservoir lines that have this node as
                         tnode.
h#nodes(node)            number of channel system lines that have this node as
                         tnode or fnode.
h#fnodes(node)           number of channel system lines that have  this node
                         as fnode.
h#tnodes(node)           number of channel system lines that have this node as
                         tnode.
h#rnodes(node)           number of channel system reservoir lines that have
                         this node as tnode or fnode.
h#rfnodes(node)          number of channel system reservoir lines that have
                         this node as fnode.
h#rtnodes(node)          number of channel system reservoir lines that have
                         this node as tnode.
To define the value of the arrays each line in hydrocov is processed. For the fnode 1 is added to the r#nodes(fnode) and r#fnodes(fnode) arrays. If the line is also a reservoir line, which it is if either the hydrocov.aat//rpoly or lpoly items are not 1 (the universal polygon), 1 is also added to the r#rnodes(fnode) and r#rfnodes(fnode) arrays. The same is done for tnode. If the line is part of the channel system (hydrocov.nat//hectype 1 or 4) the same procedure is also done for the h#nodes(node), h#fnodes(node), etc. arrays.
With the information from the previous step the node type can be calculated. Each node in hydrocov is processed. The rnodetype is determined based on the value of the arrays determined in the previous step as shown in Table 5.6. Similarly the hnodetype is determined as shown in Table 5.7. The rnodetype and hnodetype of each node is also stored in the rnodetype(node) and hnodetype(node) arrays, respectively. The node type is stored in arrays, because they are generally easier to access than table values.
Rnodetype       Criteria

updangling      r#nodes(node) = 1 and r#fnodes(node) = 1
dndangling      r#nodes(node) = 1 and r#tnodes(node) = 1
interior        r#fnodes(node) = 1 and r#tnodes(node) = 1
junction        r#fnodes(node) = 1 and r#tnodes(node) >= 2
diversion       r#tnodes(node) = 1 and r#fnodes(node) >= 2
mreservoir      r#rfnodes(node) = 1 and r#rtnodes(node) = 1
upreservoir     r#rfnodes(node) = 2 and r#rtnodes(node) = 0
dnreservoir     r#rtnodes(node) = 2 and r#rfnodes(node) = 0
dreservoir      r#rtnodes(node) = 1 and r#rfnodes(node) = 1 and
                r#fnodes(node) = 2
jreservoir      r#rtnodes(node) = 1 and r#rfnodes(node) = 1 and
                r#tnodes(node) = 2
Hnodetype       Criteria

updangling      h#nodes(node) = 1 and h#fnodes(node) = 1
dndangling      h#nodes(node) = 1 and h#tnodes(nodes) = 1
interior        h#fnodes(node) = 1 and h#tnodes(node) = 1
junction        h#fnodes(node) = 1 and h#tnodes(node) >= 2
diversion       h#tnodes(node) = 1 and h#fnodes(node) >= 2
mreservoir      h#rfnodes(node) = 1 and h#rtnodes(node) = 1
upreservoir     h#rfnodes(node) = 2 and h#rtnodes(node) = 0
dnreservoir     h#rtnodes(node) = 2 and h#rfnodes(node) = 0
dreservoir      h#rtnodes(node) = 1 and h#rfnodes(node) = 1 and
                h#fnodes(node) = 2
jreservoir      h#rtnodes(node) = 1 and h#rfnodes(node) = 1 and
                h#tnodes(node) = 2
none            h#nodes(node) = 0 and h#rnodes(node) = 0
5.4.3 Classify Elements Based on Hectype System.
After the node type has been identified the nodes are further classified as elements based on the hectype system. This is done in the same loop as the previous step (5.4.2). Each element's hectype is determined based on the criteria shown in Table 5.8.
Hectype         Element Type     Criteria

3               junctions        hnodetype(node) = junction and hectype <> 1
8               diversions       hnodetype(node) = diversion
6               sinks            rnodetype(node) = dndangling
7               sources          rnodetype(node) = updangling and
                                 hnodetype(node) = updangling
10              reservoir        hnodetype(node) = dnreservoir
1               subbasin outlet  hydrocov.nat//hectype = 1
The element is also assigned a hecid value from an incrementing hecid variable. The hecid and hectype values are written to hydrocov.nat//hecid and hectype, respectively. Again, because arrays are more easily accessed than tables, the hectype, hecid, hecx (hydrocov.nat//x-coord) and hecy (hydrocov.nat//y-coord) are written to the hectype(hecid), hecx(hecid), hecy(hecid), nhectype(node), nhecid(node) arrays.
At this point in the program the hydrotopology arrays have outlived their primary purpose. However, the h#fnodes(node) and h#tnodes(node) arrays will be of further use. They are used to store the number of downstream and upstream elements to the node respectively. For that purpose the h#fnodes(node) and h#tnodes(node) arrays are copied to arrays indexed on hecid (hh#fnodes(hecid) and hh#tnodes(hecid)). The number of lines belonging to the channel system upstream and downstream of a node is however not always equal to the number of elements upstream or downstream of a node. A reservoir outlet has two reservoir lines upstream, which are also part of the channel system. These lines do not represent two upstream elements and the hh#tnodes(hecid) is therefore reduced by the value of the h#rtnodes(node) array.
5.4.4. Calculate Subbasin Outlet Node Information.
Now that the nodes representing subbasin outlets have been identified they are related to their respective subbasins. Each line in hydrocov is processed. If the hectype of the tnode is 1 or 6 the tnode is a possible outlet of a subbasin.
In case there are more than one possible outlets from the subbasin, as is the case if there is a diversion in the subbasin, a check has to be performed to see which one is the actual outlet. That is done by comparing the elevation of the nodes which is stored in the nodez(node) array. The node with the lowest elevation is considered to be the outlet. The node number is stored in the polydnnode(poly) array.
The hh#tnodes(hecid) array is increased by 1 for the subbasin outlet. That is done to account for the fact that there is one more upstream element to the element than is indicated by the number of channel lines upstream of the node.
Figure 5.5 shows an example of data after channel elements have been established.
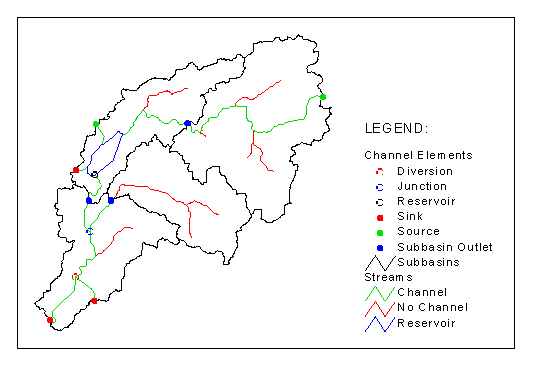
Figure 5.5. Example Results of Channel Element Identification.
5.5.1. Channel Elements and Reaches.
Channel elements are represented by nodes. They are connected by reaches which are represented by one or more lines of the channel system. Connectivity among the channel elements is calculated by looking at each node, and determining if it is an upstream end of a reach. If it is an upstream end of a reach the downstream lines are traced until a downstream end of a reach is found. All the lines between the upstream and downstream ends are combined into one reach element. If a reservoir is encountered during the tracing operation the reservoir lines are followed downstream until the reservoir element, located at the reservoir outlet, is found. If the upstream element is a diversion it will be processed multiple times.
5.5.1.1. Determine if Node is an Upstream Element.
All nodes in hydrocov belonging to the channel system (hydrocov.nat//hectype <> 2) are processed. A check is done to determine if the node is an upstream end of a reach. Upstream elements of reaches are nhectype(node) 1, 3, 7, 8, 10 and reservoir diversions (hnodetype(node) = dreservoir). See the discussion on reservoir diversions later in this section.
If the upstream element is a diversion (hydrocov.nat//hectype = 8) it is the upstream end of multiple reaches and will be processed multiple times as indicated by the hh#fnodes(hecid) array. Reservoirs are diversions if hh#fnodes(hecid) >= 2. If the node is a valid upstream element of a reach it is further processed, otherwise the next node is examined.
5.5.1.2. Trace Downstream until Downstream Element is Found.
Each line in hydrocov belonging to the channel network (hydrocov.aat//hectype = 4) that has not been processed before (hydrocov.aat//hecid = 0) is processed to find the line that has this node as fnode. That line is the first downstream line of the downstream reach. Once the line is found it is added to the current selection. Variables storing the length and slope of the reach (heclength, hecslope) are updated.
The line's tnode is evaluated to see wheter it is a valid downstream element of a reach. If the line's tnode is a valid element the end of the reach is found and the reach is 'closed', otherwise the next downstream arc has to be found. Valid downstream elements include hydrocov.nat//hectype 1, 3, 6, 8, 9 and the reservoir types 'jreservoir' and 'upreservoir' (hnodetype(node)). Note that with upreservoirs and jreservoirs the channel closes, but we have to continue downstream along the shore of the reservoir to find the dnreservoir.
The 'reservoir extension' is similar to the previous step However, the variables heclength and hecslope do not get updated for each line. Also care has to be taken not to leave the reservoir on a reservoir diversion. Only lines that are adjacent to a reservoir (hydrocov.aat//rpoly# <> 1 or lpoly# <> 1) are therefore valid.
If the lines tnode is a reservoirs (hydrocov.nat//hectype = 10) the reach is closed. For each reservoir we encounter this way we have to update the hh#tnodes(hecid) array since there is now one more upstream elements than indicated by the number of channel system lines entering the node.
Once the reach is closed the hydrocov.aat//hecid item of all the lines in the reach gets updated with the current hecid value. The hectype(hecid), hecx(hecid), hecy(hecid) and hecdnid(n, hecid) [n is an integer indicating the specific downstream element, for the case of a reach always 1] variables get updated. The hecupid, hecdnid, heclength and hecslope values are written to all the lines of the reach element (hydrocov.att//hecupid, hecdnid, heclength and hecslope). Note that for the case of multiple hecupid's or hecdnid's 0 will be recorded.
5.5.1.5. Record Upstream Element Data.
The hecid of the reach is written to the hydrocov.nat//hecdnid item of the upstream element. In case of a diversion 0 will be recorder for hydrocov.nat//hecdnid. The hectype(hecid), hecx(hecid) and hecdnid(n, hecid) arrays are updated for the upstream element.
5.5.1.6. Record Downstream Element Data.
The hecid of the reach is written to the hydrocov.nat//hecupid item of the downstream element. In case of a junction 0 will be recorded. The hecupid(n, hecid) array is updated for the downstream element. The hectype(hecid), hecx(hecid), hecy(hecid) and hecupid(n, hecid) arrays are updated for the downstream element.
Subbasin elements are represented by polygons or their centroids. They are connected to subbasin outlets by means of a link. The connectivity among the subbasins and the subbasin outlets was established in Section 5.4.4. Here the subbasins get assigned hecids and several attributes are calculated and recorded.
5.5.2.1. Create Subbasin Point Coverage.
In following attribute calculations a point coverage of the subbasins is needed. A point coverage of the subbasin centroids (subcov2) is created from subcov using the arcplot CREATE command. A previously existing subcov2 is deleted using the arc KILL ALL command.
Point topology is created using the arc BUILD command and the xy coordinates get added to subcov2.pat using the arc ADDXY command. The intx and inty items get added to subcov2.pat and subcov.pat and are assigned the x and y coordinates, respectively. The purpose of the intx and inty items is to preserve the original xy coordinates, because subsequent operations will modify the x-coord and y-coord values.
5.5.2.2. Set Up Hydrocov for Network and Dynamic Segmentation.
Hydrocov is prepared for dynamic segmentation and network processing. Routes are created for each line in hydrocov using the arc ARCSECTION and MEASUREROUTE commands. Hydrocov is designated as network coverage using the arcplot NETCOVER command.
5.5.2.3. Record General Subbasin Data.
Each polygon in subcov, except for the universal one, is processed. The current hecid is written to subcov.pat//hecid. Subcov.pat//hectype is set to 5. The number of the subbasin outlet node is obtained from polydnnode(poly). The hecid of the subbasin outlet, as obtained from nhecid(node), is written to subcov.pat//hecdnid. The hectype(hecid), hecx(hecid), hecy(hecid) and hecdnid(n, hecid) arrays are updated for the polygon. The hecupid(n, hecid) array for the subbasin outlet is updated.
5.5.2.4. Write Coordinates of Subbasin Boundary to a File.
The coordinates of the subbasin boundary are written to a text file. This is done in the same loop as the previous step. All the lines belonging to the subbasin polygon are selected. The selection set is written to a file with the arcplot WRITESELECT command. That selection file is then used with the arc RESELECT command to create a coverage consisting only of the lines of the subbasin polygon (bound). A previously existing bound is deleted using the arc KILL ALL command. Then the arc UNGENERATE command is used to write the coordinates of the subbasin boundary to a text file. The name of the text file is written to subcov.pat//b-coord.
5.5.2.5. Calculate Attributes of Longest Flow Path.
The coordinates, elevation of upstream end and length of longest flowpath are computed. This is done in the same loop as the previous step.
All the hydrocov lines in the subbasin polygon are selected. What polygon the lines are in can be determined from hydrocov.aat//subcov#. All the hydrocov lines in the subbasin polygon are processed. For each line the fnode and tnode is added to the current hydrocov node selection set. All the hydrocov nodes in the subbasin polygon are then written to a selection file using the arcplot WRITESELECT command. This
The distance between all the nodes in the subbasin is computed and written to a file (distfile) using the arcplot NODEDISTANCE command. The distfile records specifying distances from the subbasin outlet node (polydnnode(node)) are selected. Each of the selected records in distfile is then processed to find the record with the greatest node to node distance. That record specifies the length of the longest flow path and the node representing the upstream end of the longest flow path.
The elevation of the upstream end is obtained from the nodez(node) array. To get the coordinates of the longest flow path, the arcplot TRACE command is used to identify the lines downstream of the node. The coordinates of those lines are then written to a text file in the same manner the coordinates of the boundary are written to a file in Section 5.5.2.4. The length, elevation of the upstream end, and the name of the file holding the coordinates of the longest flow path are written to the subcov.pat//flength, fupz and f-coord.
This is done in the same loop as the previous step. The coordinates of the point on the longest flowpath nearest to the centroid are found from the coverage of the longest flow path (previous step) and subcov2 using the arc NEAR command. The intx and inty items are used to relate back to subcov and select the point belonging to the current subbasin. The x-coord and y-coord items can not be used, because their values are modified by the operation.
The length is obtained by adding two parts. The first part (flength2a) is the length from the next downstream node from the point to the subbasin outlet. Flength2a is determined from distfile. The second part (flength2b) is the fractional length along the line obtained with dynamic segmentation. Figure 5.6 illustrates. The length is written to subcov//flength2. Box 5.4. lists the arcplot syntax.
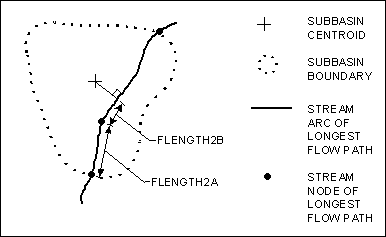
Figure 5.6. Flength2 Illustration.
&sys arc near subcov2 path line 1000000 # location
unselect subcov2 points
aselect subcov2 points ( intx = %:cur6070.intx% )
unselect subcov2 points ( inty ne %:cur6070.inty% )
&sv nearx = [show select subcov2 point 1 item x-coord]
&sv neary = [show select subcov2 point 1 item y-coord]
unselect hydrocov arcs
aselect hydrocov arcs one *
%nearx%, %neary%
&sv tnode = [show select hydrocov line 1 item tnode#]
unselect distfile info ( hydrocov#b ne %tnode% )
&sv flength2a = [show select distfile info 1 item network]
measure route hydrocov fpath
%nearx%, %neary%
&sv flength2b = [extract 5 [show measure route]]
&sv flength2 = %flength2a% + %flength2b%
&s :cur6070.flength2 = %flength2%
Reservoir diversions are represented by nodes on reservoirs (see node type 'dreservoir' in Figure 5.4). Similar to the channel elements described in Section 5.5.1 they are connected to downstream channel elements by reaches. Their downstream connectivity was calculated in Section 5.5.1. However, the seven element system does not support reservoir diversions as separate elements. In that system a diversion out of a reservoir is handled by having multiple reaches downstream of the reservoir element. The reservoir diversion therefore has to be eliminated by assigning the corresponding reservoir to the upstream end of the reach.
5.5.3.1. Find Reservoir Diversion.
Each node in hydrocov belonging to the channel network and not having been classified as another hectype is processed. If the node is hnodetype(node) dreservoir the node is further processed. Otherwise the search is continued.
5.5.3.2. Find Downstream Reach.
The hecid of the downstream reach is obtained by processing each line in hydrocov. The line is the first line of the downstream reach if it has the node as fnode and if it is not located along the reservoir (hydrocov.aat//rpoly# = 1 and lpoly# = 1).
5.5.3.3. Find Reservoir Element.
The dnreservoir of the reservoir is found by first finding the upstream line to the reservoir diversion. In a manner similar to how the downstream line was found in the previous section. That line is determied by having the node as tnode. Then the hydrocov polygon number of the reservoir is determined. It is the non-1 value of hydrocov.aat//rpoly# and lpoly#. Knowing the polygon number of the reservoir all the lines in hydrocov belonging to the reservoir are selected. Each of the selected lines is then processed. The dnreservoir is the first fnode or tnode encountered that has hnodetype(node) dnreservoir.
Once all the elements involved are determined several arrays are updated.
Any dnreservoir encountered this way has one more downstream element as indicated by the number of downstream lines (or as previously assumed). The hh#fnodes(hecid) arrays is therefore increased by 1. The hecid of the reservoir is written to hydrocov.aat//hecupid and hecupid(n, hecid) array.
Figure 5.7 shows an example of data after connectivity was calculated.
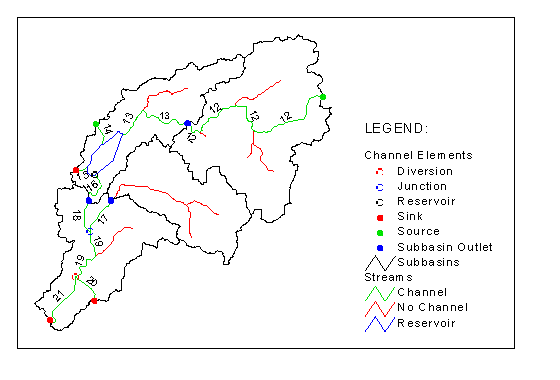
Figure 5.7. Example Results of Connectivity Calculation.
5.6. Create Symbolic Coverage.
A symbolic coverage representing the watershed in a stick diagram fashion is produced. The creation of the coverage is based solely upon data collected throughout the previous program run.
An empty coverage (symcov) is created from hydrocov using the arc CREATE command. A previously existing symcov is deleted. Node topology is created and the hecid item is added to symcov.nat. Line topology is created and the hecid, uphecid and dnhecid items are added to symcov.aat.
The channel system is created by processing each element previously established. If the element is an upstream end of a reach it has a corresponding reach element. That reach element has a corresponding downstream element. A line will be added from the coordinates of the upstream element to the coordinates of the downstream element. Then the next element is processed.
5.6.1.1. Find Upstream Element.
Each element is processed based on the number of hecid's assigned. The element is an upstream end of a reach if it's hectype(hecid) is 1, 3, 7, 8 or 10. Diversions (hectype 8) and reservoirs with multiple downstream elements (hh#fnodes(hecid) > 1) have to be processed multiple times.
The first downstream element is determined based on the hecdnid of the current element. That element is a reach.
5.6.1.3. Find Downstream Element.
The second downstream element is determined based on the hecdnid of the reach.
A line is added to symcov based on the xy coordinates of the upstream and downstream elements. The hecid of the reach is written to symcov.aat//hecid item. The hecid of the upstream and downstream elements of the reach is written to symcov.aat//uphecid and dnhecid elements, respectively.
Subbasins are processed similar to the Channel System in Section 5.6.1 except that there is no element between the subbasin and the subbasin outlet. Each element is processed. If it is a subbasin, it's corresponding subbasin outlet is found and a line is added between them.
5.6.2.1. Find Subbasin Element.
Each element is processed based on the number of hecid's assigned,
similar to the previous step, starting with hecid 1. A line will
be added from the subbasin centroid to the subbasin outlet if
in fact we are at a subbasin element (hectype(hecid) =
5).
5.6.2.2. Find Subbasin Outlet Element.
The subbasin outlet is found based on the hecdnid(hecid)
of the subbasin element.
A line is added based on the xy coordinates of the subbasin element
and subbasin outlet element. The hecid item is assigned 0.
A link will have to be made from the nodes in symcov to other
files based on a common hecid. Since so far the hecid's are only
written to symcov.aat, they have to be transfered to symcov.nat.
First node and line topology is build.
Each line in symcov is processed. The hecid of the upstream and
downstream ends is writen to a new array called hecid2(node).
Each node in symcov is processed. The hecid2(node) array
is used to write the hecid value of the element to the hecid item
in symcov.nat.
Figure 5.8 shows an example symbolic coverage.
Figure 5.8. Example Symbolic Coverage.
5.7. Relate Attributes to Symbolic Coverage.
The symbolic coverage does not contain any attribute values.
Attributes are stored in the subbasin coverage and the hydrologic
coverage and can be accessed through relates. The attributes
that can be accessed this way are not limited to the ones from
this discussion. Any attributes from the input coverages can
be accessed this way.
Three relates are established using the arc RELATE ADD command.
The relates are:
The relates are based on a common hecid value.
At this point the program has finished compiling the data. Part
of the final output, the hydrologic and symbolic coverages, is
complete. This part of the program creates the DXF file, general
output file and HMS basin file.
The arc ARCDXF command is to be used to create a DXF file of
the streams and subbasins in the watershed. The command can only
convert a single coverage to a DXF file. The coverages streamcov
and subcov have to be combined into a single one. Further,
their attribute fields have to be consistent and contain the 'dxf-layer'
item if the features are to be on separate layers.
5.8.1.1. Create Combined Coverage.
Streamcov and subcov are copied to streamcov2
and subcov2, respectively with the arc COPY command. Streamcov2.aat
and subcov2.aat are then deleted with the tables ERASE
command. Line topology is rebuild with the arc BUILD command
and the 'layers' item is added to streamcov2.aat and subcov2.aat
using the arc ADDDITEMS command. The 'layers' item in streamcov2.aat
and subcov2.aat is then set to 'streams' and subbasins,
respectively, using the arcplot CALCULATE command. The coverages
are then combined into a single coverage (dxfcov) using
the arc APPEND command.
Finally the arc ARCDXF command is used to create the DXF file
from dxfcov. The temporary coverages streamcov2,
subcov2 and dxfcov are deleted using the arc KILL
ALL command.
An example DXF file is presented in Appendix B.
5.8.2. Create General Text File and HMS Basin File.
The general text and HMS basin files list hydrologic elements
and their attributes by element type (see Sections 3.2 and 3.3).
Since the files are structured roughly the same they are created
at the same time. The attribute data is accessed from the hydrologic
and symbolic coverages through relates.
Two output files are opened with the AML OPEN function and headers
are written to the file using the AML WRITE function.
Each element type is processed seperately and the corresponding
information is written to the text file based on the value in
the related attribute file as show in Table 5.9.
After all the attributes have been written to the file it is closed
using the AML CLOSE function. An example general output
file is presented in Appendix B.
Go to: Short Table of Contents, Long Table of Contents, HECPREPRO Page.
Bhaskar, N. R., James, W. P., Devulapalli, R. S., 1992, Hydrologic
Parameter Estimation using Geographic Information System, Journal
of Water Resources Planning and Management, vol. 118, no. 5, p.
492-512.
Fisher, G. T., Geographic Information System/Watershed Model Interface,
Proceedings of the 1989 National Conference on Hydraulic Engineering,
ASCE, New York, 1989.
Innovative System Developers, Inc., Geo-STORM Hydrology, Version
1.5 Beta, Columbia, MD, 1995.
Maidment, D. R., Developing a Watershed Data Structure, prepared
for the Hydrologic Engineering Center, US Army Corps of Engineers,
Davis, Calif., under Contract DACW05-92-P-1864, April 9, 1993.
Saghafian, B., Implementation of a Distributed Hydrologic Model
within GRASS, GIS and Environmental Modeling: Progress and Research
Issues, Goodchild, M. F., Steyaert, L. T., Parks, B. O., Johnston,
C., Maidment, D., Crane, M., Glendinning, S., Editors, GIS World
Books, Fort Collins, CO, 1996.
Shea, C., Grayman, W., Darden, D., Males, R. M., Sushinsky, P.,
1993, Integrated GIS and Hydrologic Modeling for Countywide Drainage
Study, Journal of Water Resources Planning and Management, vol.
119, no. 2, p. 112-128.
Stuebe, M. M., Johnston, D. M., 1990, Runoff Volume Estimation
Using GIS Techniques, Water Resources Bulletin, vol. 26, no. 4,
p. 611-620.
Warwick, J. J., Haness, S. J., 1994, Efficacy of ARC/INFO GIS
Application to Hydrologic Modeling, Journal of Water Resources
Planning and Management, vol. 120, no. 3, p. 366-381.
Go to: Short Table of Contents, Long Table of Contents, HECPREPRO Page.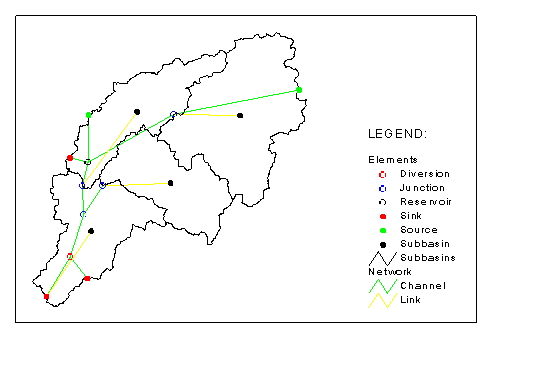
Element Type   Information   Description
               Written to
               File

Subbasin       hecid         I.D.
               x-coord       x coordinate of centroid
               y-coord       y coordinate of centroid
               cenz          elevation of centroid
               b-coord       name of file holding coordinates of
                             subbasin boundary
               f-coord       name of file holding coordinates of
                             longest flow path
               fupz          elevation of upstream end of longest flow
                             path.
               flength       length of longest flow path
               flength2      length along longest flow path from point
                             nearest to subbasin centroid to subbasin
                             outlet.
               area          area
               means         mean surface slope
               medians       median surface slope
               hecdnid       I.D. of downstream element.

Source         hecid         I.D.
               x-coord       x coordinate
               y-coord       y coordinate
               nodez         elevation
               hecdnid       I.D. of downstream element.

Reaches        hecid         I.D.
               heclength     length
               hecslope      slope
               hecupid       I.D. of upstream element.
               hecdnid       I.D. of downstream element.

Junctions      hecid         I.D.
               x-coord       x coordinate
               y-coord       y coordinate
               nodez         elevation
               hecupid(s)    I.D. of upstream element(s)
               hecdnid       I.D. of downstream element

Reservoirs     hecid         I.D.
               x-coord       x coordinate
               y-coord       y coordinate
               nodez         elevation
               hecupid(s)    I.D. of upstream element(s)
               hecdnid(s)    I.D. of downstream element(s)

Diversions     hecid         I.D.
               x-coord       x coordinate
               y-coord       y coordinate
               nodez         elevation
               hecupid       I.D. of upstream element
               hecdnids      I.D. of downstream element(s)

Sinks          hecid         I.D.
               x-coord       x coordinate
               y-coord       y coordinate
               nodez         elevation
               hecupid(s)    I.D. of upstream element(s)
Table 5.9. Description of Data Written to Output Files.
Element Type       Information        Source of
                   Written to File    Information

Subbasin           hecid              symcov.nat
                   x-coord            subcov.pat
                   y-coord            subcov.pat
                   cenz               subcov.pat
                   b-coord            subcov.pat
                   f-coord            subcov.pat
                   fupz               subcov.pat
                   flength            subcov.pat
                   flength2           subcov.pat
                   area               subcov.pat
                   means              subcov.pat
                   medians            subcov.pat
                   hecdnid            subcov.pat

Source             hecid              symcov.nat
                   x-coord            hydrocov.nat
                   y-coord            hydrocov.nat
                   nodez              hydrocov.nat
                   hecdnid            hydrocov.nat

Reaches            hecid              symcov.aat
                   heclength          hydrocov.aat
                   hecslope           hydrocov.aat
                   hecupid            hydrocov.aat
                   hecdnid            hydrocov.aat

Junctions          hecid              symcov.nat
                   x-coord            hydrocov.nat
                   y-coord            hydrocov.nat
                   nodez              hydrocov.nat
                   hecupid(s)         hecupid(n, hecid)
                   hecdnid            hydrocov.nat

Reservoirs         hecid              symcov.nat
                   x-coord            hydrocov.nat
                   y-coord            hydrocov.nat
                   nodez              hydrocov.nat
                   hecupid(s)         hecupid(n, hecid)
                   hecdnid(s)         hecdnid(n, hecid)

Diversions         hecid              symcov.nat
                   x-coord            hydrocov.nat
                   y-coord            hydrocov.nat
                   nodez              hydrocov.nat
                   hecupid            hydrocov.nat
                   hecdnids           hecdnid(n, hecid)

Sinks              hecid              symcov.nat
                   x-coord            hydrocov.nat
                   y-coord            hydrocov.nat
                   nodez              hydrocov.nat
                   hecupid(s)         hecupid(n, hecid)
Table 5.10. Source of Data Written to Output Files.